Economists and others have been predicting monthly increases in rent would stall or fall for two years. Year-over-year rates are down, but monthly increases are still big.

Chart Notes
- NTR is the New Tenant Rent index from the Cleveland Fed. Lower and Upper are confidence bounds. These are new leases only.
- CPI rent is Rent of Primary residence as measured by the BLS. These are new and existing leases.
- OER is Owners’ Equivalent Rent a measure of rent for people who own their own houses. The index measures rent of houses unfurnished without utilities. It should and does track Rent of Primary Residence. These are new and existing leases.
- Zori is the Zillow Observed Rent Index. These are new leases only.
- Apt List is the Apartment List Rent Index. These are new leases only. This index is not seasonally adjusted, the rest are.
Everyone is attempting to calculate when the CPI will head lower based on when rent of primary residence and OER head lower. The idea is based off lead times of new leases.
The BLS smooths things out over 12 months and seasonally adjusts the numbers too. But other than Apartment List, all of the numbers are seasonally adjusted.
Index Peaks
- Apartment List: 2021 Q4, 18.10%
- Zori: 2022 Q1, 16.27%
- NTR: 2022 Q2, 12.15%
- OER: 2023 Q1, 8.00%
- Rent: 2023 Q1, 8.80%
The CPI measures lag Apartment List by 15 months, Zori by a year, and NTR by 9 months.
So, is the lead time 9 months or 15? More importantly, how much does it matter?
What Percentage of People Move?
- Shyft Moving says 9.8 percent move each year.
- According to an analysis of 2022 U.S. Census Bureau data published by Brookings, overall migration within the United States was 8.7%.
On the basis on what 9 percent of people do, with peak moving months between Mid-May and Mid-September, economists are attempting to predict rents for the remaining 91 percent of people who stay put.
New leases have been rising at a much faster pace than a blend of new and existing leases.
Apartment List, Zori, and NTR all use methodology that compares the same or similar unit over time. But NTR says the peak year-over-year rate was 12.15 percent while Zori and Apartment List are much higher at 16.27 percent and 18.10 percent respectively.
NTR was created in conjunction with the BLS, using similar methodology.
Only a Decline in Gasoline Prevents a Hot CPI

On December 12, I noted Rent Jumps Another 0.5 Percent, Only a Decline in Gasoline Prevents a Hot CPI
Rent, which is sticky, rose at least 0.4 percent for the 28th month.
A Curious Claim that the BLS Is Overstating Rent and Exaggerating Inflation
On December 7, I investigated a Curious Claim that the BLS Is Overstating Rent and Exaggerating Inflation
The belief is based on huge declines in new tenant rent indexes. But which one of the indexes is right and what is the lag?
In particular, note the confidence level interval or NTR from -0.73 to +6.20.
As more data comes in the confidence level will increase. But NTR which is supposed to be a timely measure now lags the CPI by a quarter.
What About Algorithms?
Please consider Rent Going Up? One Company’s Algorithm Could Be Why.
On a summer day last year, a group of real estate tech executives gathered at a conference hall in Nashville to boast about one of their company’s signature products: software that uses a mysterious algorithm to help landlords push the highest possible rents on tenants.
“Never before have we seen these numbers,” said Jay Parsons, a vice president of RealPage, as conventiongoers wandered by. Apartment rents had recently shot up by as much as 14.5%, he said in a video touting the company’s services. Turning to his colleague, Parsons asked: What role had the software played?
“I think it’s driving it, quite honestly,” answered Andrew Bowen, another RealPage executive. “As a property manager, very few of us would be willing to actually raise rents double digits within a single month by doing it manually.”
For years, RealPage has sold software that uses data analytics to suggest daily prices for open units. Property managers across the United States have gushed about how the company’s algorithm boosts profits.
“The beauty of YieldStar is that it pushes you to go places that you wouldn’t have gone if you weren’t using it,” said Kortney Balas, director of revenue management at JVM Realty, referring to RealPage’s software in a testimonial video on the company’s website.
The nation’s largest property management firm, Greystar, found that even in one downturn, its buildings using YieldStar “outperformed their markets by 4.8%,” a significant premium above competitors, RealPage said in materials on its website. Greystar uses RealPage’s software to price tens of thousands of apartments.
“Machines quickly learn the only way to win is to push prices above competitive levels,” said University of Tennessee law professor Maurice Stucke, a former prosecutor in the Justice Department’s antitrust division.
One advantage RealPage’s data warehouse had was its access to actual lease transactions — giving it the true rents paid, instead of simply those a landlord advertised, RealPage said.
Zillow Uses Listed Rates
“Zillow Observed Rent Index (ZORI): A smoothed measure of the typical observed market rate rent across a given region. ZORI is a repeat-rent index that is weighted to the rental housing stock to ensure representativeness across the entire market, not just those homes currently listed for-rent. The index is dollar-denominated by computing the mean of listed rents that fall into the 40th to 60th percentile range for all homes and apartments in a given region, which is weighted to reflect the rental housing stock.”
Zori says it uses listed rents in the 40th to 60th percentile range, not actual signed rents. And it does not include renewals at all.
It’s tough to discount 28 consecutive months of rent going up at least 0.4 percent unless you think the BLS is overstating rent.
What About the Massive Amount of Units Under Construction?
Another popular idea is that rents will decline once housing units are completed.
This sounds very reasonable but a chart of the results shows something else.
Housing Units Under Construction vs CPI Rent Year-Over-Year
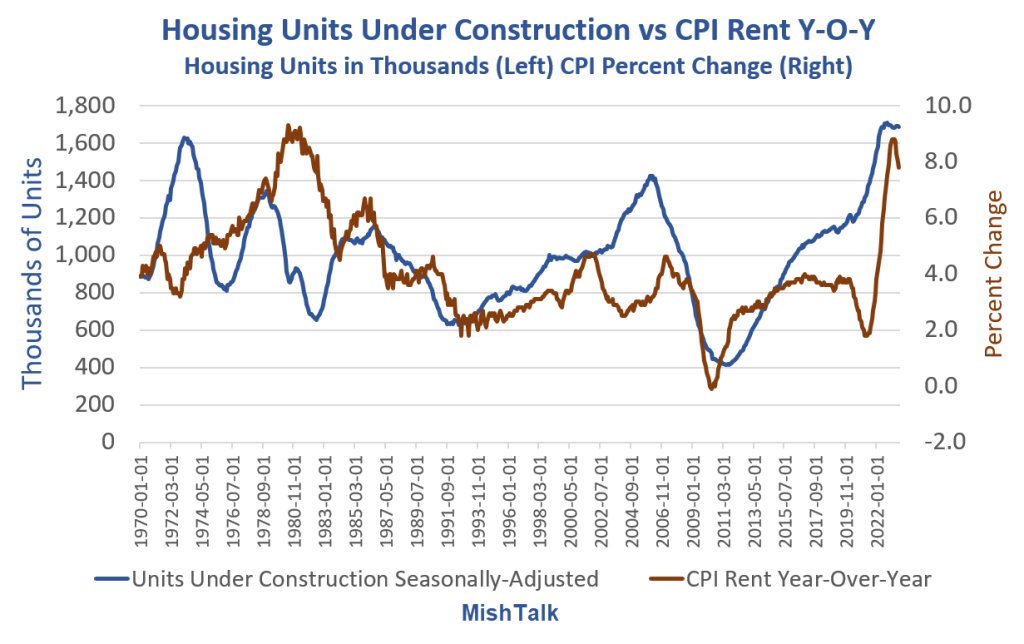
For discussion, please see When Will Record Housing Units Under Construction Ease Rent Inflation?
The data shows no discernable correlation no matter how you shift the lead or lag times.
The chart looks totally random. So perhaps rent abate. Perhaps not. The data itself provides no reason to believe anything.
But please note the floor. Year-over-year rent has a floor of about 2 percent except in the Great Recession housing crash.
Would a 4 percent rate of rent increases please the Fed? 3 percent?
Are Rents Poised to Drop? Stabilize? What?
I don’t know, nor does anyone else.
Year-over-year rents have peaked, but a lot of that is easy year-over-year comparisons.
Looking ahead, I am finally in the camp that we will break the string of big rent increases. Previously I had been a doubter. However, all such expectations have been wrong for two years.
https://mishtalk.com/economics/why-predictions-of-when-the-price-of-rent-will-fall-have-been-wrong/
No comments:
Post a Comment