Search This Blog

Tuesday, July 31, 2018

New deal for Waterfront Toronto, Sidewalk Labs trims controversial plans

After months of talks, Waterfront Toronto and Sidewalk Labs LLC have signed a deal that reins in some of the Google-affiliate’s controversial plans around its proposed “test bed” for new urban technologies on the city’s lakeshore.
On Tuesday, Waterfront Toronto released both a new 58-page “plan development agreement” as well as the original “framework agreement” it had signed last fall with Sidewalk, the full text of which had until now been kept secret.
The new deal walks back or clarifies a number of provisions contained in that original deal, signed after Sidewalk Labs, a unit of Google-parent Alphabet Inc., was chosen as the “funding and innovation partner” to develop a 12-acre parcel of land on the waterfront known as Quayside.
Waterfront Toronto and the New York-based Sidewalks Labs praised the deal as an important milestone as they continue to develop the project, which some critics have warned will involve collecting too much data, or give too much control to Sidewalk over the city’s waterfront plans.
Sidewalk has said it wanted to develop a long list of futuristic “smart city” innovations including sensors to detect pedestrians at traffic lights, robot vehicles that whisk away garbage in underground tunnels and a new street layout to accommodate a fleet of shared self-driving cars. But Sidewalk argued that much of what it planned required more than just the Quayside parcel to work.
According to documents released by Waterfront Toronto, the original framework deal suggested that Sidewalk would be given the right to ramp up its plans across the 800-acre Eastern Waterfront when it came under Waterfront Toronto’s purview. Those lands, which are mostly city-owned, were due to be handed over to Waterfront Toronto, a corporation jointly controlled by all three levels of government with a mandate to develop the waterfront.
But the deal signed on Tuesday says that, except for the initial Quayside parcel, no other waterfront lands will be automatically included in the project, except as justified with a “business case” and other government approvals.
No transfer or sale of land is included in Tuesday’s deal, although the original agreement “contemplated options or requirements to transfer or make land available” to Sidewalk Labs. Waterfront Toronto officials say expanding the project across other lands is still a possibility.
The new deal also says Sidewalk’s initial $50-million investment, some of which is being spent on a series of public consultations and work developing it plans, does not count as equity in the development – a possibility neither Sidewalk nor Waterfront Toronto had previously revealed. However, Tuesday’s deal does say that if the final plans are approved, the $50-million could be recovered in Sidewalk’s share of any profits.
The original framework was thin on details about Torontonians’ data and privacy. The new agreement outlines a number of protections and promises, including a pledge to “create the most privacy protected/citizen-centered set of policies and governance structures in the world, recognizing privacy as a fundamental human right.” But specifics still remain to be worked out.
The new deal, signed three months later than originally scheduled, comes after the sudden departure in early July of Waterfront Toronto’s CEO, Will Fleissig, who had been a driving force behind the project. Tuesday’s deal is only a step toward a final “master innovation and development plan,” which the waterfront agency says won’t be signed until next year.
The latest deal was approved unanimously by Waterfront Toronto’s board on Tuesday, but only after Toronto developer Julie Di Lorenzo, who has previously publicly questioned the plan, resigned from her seat on the board. Ms. Di Lorenzo could not be reached.
Under the new agreement, the deal can be terminated if the master plan is not approved by Sept. 30 next year. But Waterfront Toronto officials say they expect a deal by the spring – elements of which may come before Toronto’s city council for approval. The city is also contemplating holding its own public consultations on its plans.
Michael Nobrega, the acting CEO of Waterfront Toronto and the former president and CEO of the Ontario Municipal Employees Retirement System (OMERS), who signed the deal, says the new agreement protects the public interest.
“If at any time this project goes sideways, we have lots of exits, at no cost,” Mr. Nobrega said. “This thing is an opportunity for us to actually I think meet the mandate that the founders outlined for the entity [Waterfront Toronto], an exciting opportunity to build a world-class waterfront.”
Toronto Mayor John Tory issued a statement welcoming the new agreement, saying it will allow “the City to consider an innovative new approach to development, housing, public space and mobility in the Quayside District.”
Mr. Tory said he was confident that Waterfront Toronto and Mr. Nobrega and all three governments would ensure the project proceeds in the “best interest of Toronto residents, with a focus on process, privacy, and real public benefit.”
Saturday, July 28, 2018

Has the Housing Market Peaked?

On Friday I wrote: Has Housing Market Activity Peaked? I concluded
“I do not think housing has peaked, and I think new home sales and single family starts will increase further over the next couple of years.”
Since then we’ve seen several reports of softening existing home sales in a number of cities (Seattle, Portland, California, and more). And the NAR reported sales were down year-over-year in June, and probably more important that inventory was up year-over=year for the first time since June 2015.
As I noted last Friday, I think it is likely that existing home sales will move more sideways going forward. However it is important to remember that new home sales are more important for jobs and the economy than existing home sales. Since existing sales are existing stock, the only direct contribution to GDP is the broker’s commission. There is usually some additional spending with an existing home purchase – new furniture, etc. – but overall the economic impact is small compared to a new home sale.
Also I think the growth in multi-family starts is behind us, and that multi-family starts peaked in June 2015. See: Comments on June Housing Starts
For the economy, what we should be focused on are single family starts and new home sales. As I noted in Investment and Recessions “New Home Sales appears to be an excellent leading indicator, and currently new home sales (and housing starts) are up solidly year-over-year, and this suggests there is no recession in sight.”
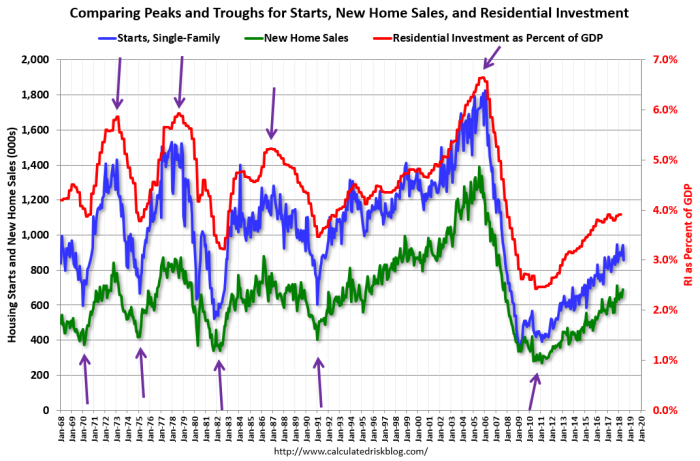
For the bottoms and troughs for key housing activity, here is a graph of Single family housing starts, New Home Sales, and Residential Investment (RI) as a percent of GDP.
housingpeaksbottoms
The arrows point to some of the earlier peaks and troughs for these three measures.
The purpose of this graph is to show that these three indicators generally reach peaks and troughs together. Note that Residential Investment is quarterly and single-family starts and new home sales are monthly.
RI as a percent of GDP has been sluggish recently, mostly due to softness in multi-family residential.   However, both single family starts and new home sales are still moving up (ignoring month-to-month fluctuations).
Also, look at the relatively low level of RI as a percent of GDP, new home sales and single family starts compared to previous peaks.   To have a significant downturn from these levels would be surprising.
So my view remains: I do not think housing has peaked, and I think new home sales and single family starts will increase further over the next couple of years.
https://bit.ly/2LL8VoP

Chinese Investors Do About-Face, Start Selling U.S. Commercial Properties

Chinese investors pulled back from U.S. commercial real estate in a big way in the second quarter, buying only $126.2M worth of properties. At the same time, they sold a total of nearly $1.3B worth of U.S. commercial real estate, according to Real Capital Analytics data.
That is the first time since before the 2008 recession that Chinese investors have been net sellers of U.S. commercial real estate. The slowdown in Chinese investment and selling spree was spurred by the Chinese government’s crackdown on overseas acquisitions, the Wall Street Journal reports, as the government looks to stabilize the yuan.
“I’m shocked. They really curtailed their buying and stepped up sales,” Real Capital Analytics Senior Vice President Jim Costello told the WSJ.
The drop follows a surge in investment that began a few years ago when the Chinese government loosened restrictions on companies buying overseas assets. Investors tended toward trophy properties in gateway markets, such as the record-breaking $1.9B that Anbang paid for the Waldorf Astoria hotel in New York in 2015 (as of yet, the hotel hasn’t been re-sold).
The change has been sudden. As recently as Q1, Chinese investors bought about $4.2B of U.S. real estate assets, while selling only $450M. The Q1 numbers, however, represented a brief spike as well, since during the last half of 2017, Chinese investors barely bought or sold any U.S. real estate. Some of the recent sellers include HNA Group and Greenland Holding Group. Just last month, HNA Property Holdings sold City Center in Downtown Minneapolis to a non-Chinese overseas buyer new to the Twin Cities market for $320M, compared to the $315M it paid in late 2016.

Adding Resi To Retail: How It Works In Practice

Adding residential space to retail centres is a hot topic right now.
In its strategy review announced this week, Hammerson said it had set up a whole new division to look at adding residential and other kinds of property use like leisure and flexible workspace to 65 acres around its shopping centres.
And at Bisnow’s Retail Revolutions 2018 event last week, panelists pointed to how residential had been added to a town centre retail scheme in Oslo to help solve the city’s housing crisis, with the added bonus of boosting retail values.
There is one company that has been doing this for a while now. NewRiver owns 34 community shopping centres, 21 retail parks and 600 pubs across the U.K. The FTSE 250-listed company also has a development pipeline of 1,100 residential units totalling around 1M SF, which it is in the process of adding to its existing portfolio. In a trading update last week, it said it identified the possibility of adding a further 1,300 units in the medium term. It is also looking to add community facilities like medical centres and even a mini hospital to some of its retail properties.
Saying you will add resi space to retail centres is all well and good, but how does this work in practice? Careful underwriting and creative vision are required. And to revive some of the U.K. town centres that are really struggling, innovation in construction will be required.
Here is what you need to know. Underwriting is crucial. NewRiver looks to buy assets with sustainable long-term income where there is the potential to add residential, but certainly doesn’t bank on it.
“We never price [adding residential] into what we pay for an asset,” NewRiver Chief Executive Allan Lockhart said. “All the assets we buy have to provide a steady and stable income stream, and that is where we make out core return, but we look for assets that might also offer growth through the potential to add things like residential.
“Residential creates footfall through a centre and helps stimulate the nighttime economy, all of which has a beneficial effect on the retail elements of a scheme.”
What to look for: Lockhart said NewRiver tries to think creatively about how and where residential is added to the company’s schemes.
“There could be a car park which is too big and is underutilised, it could be the air space above a centre, it could be adjacent land, or it could be space above shops that is not being utilised,” he said.
But one thing to bear in mind: “You have to make sure that the you can build the resi without disrupting the retail income stream,” he said.
For example, it recently added 36 residential units above a Sainsbury’s supermarket at its scheme in East Ham, east London, while the store continued to trade.
Residential isn’t a panacea for every scheme — not yet, anyway. NewRiver’s Justin Thomas Lockhart made the point that, in some areas, it does not make sense to add residential to a scheme, because the price at which you could sell the completed units is below what it would cost to build. When a developer needs existing income to essentially fund build costs, it makes it difficult to buy malls with too much vacancy and add residential to bring the centre back to life. But methods such as modular and off-site construction have the effect of bringing build costs down, thus making the strategy more viable in areas with lower residential prices. And off-site construction also enables construction to take place without the need to close large parts of a centre down.
“We are actively looking at innovations in construction to bring the cost down, and as we do that, might enable to expand our residential programme,” Lockhart said.
Think flexibly and look beyond residential. Permitted development rights, which allowed the conversion of office space to residential without planning consent, had a big effect to help create more residential space in town centres. The same move for retail could have a big impact, too.
“I would like us to have more flexibility in the planning system, to allow us to bring more residents in to the schemes that we own,” NewRiver Residential Director Justin Thomas said. He said the developers and owners needed to think flexibly about providing space that could be used both by retailers, for pop-up stores or events, and residents, essentially reinventing the concept of the village hall.
“That flexibility is beneficial to retailers and the wider community as well,” he said.
Work with local authorities to add services communities need. The Forum in Wallsend after the addition of a new library and customer service centre Other community facilities like libraries, customer service centres and medical facilities could have a big impact, Lockhart said, citing the example of NewRiver’s scheme in Wallsend, Tyneside, where it added a library plus other facilities and saw footfall rise by around 20%. He said working with local authorities as a long-term investor meant that they were willing to provide funding for these services even at a time of central-government cutbacks, which provided a wider benefit to communities and town centres.
“There are local authorities up and down the country finding innovative ways to fund services,” he said. In terms of adding residential, Thomas said local authorities appreciated the wider benefits for communities. “You are pushing at an open door,” he said.

Americans (single proprietors, that is) have been saving more than we thought

The US savings rate was higher in recent years than previously measured, according to revised official figures that assume greater levels of tax evasion by business owners.
The data show the average savings rate at 7 per cent between 2013 and 2017, up from the previous figure of 5 per cent.
The revision came in the latest economic statistics update from the Bureau of Economic Analysis, which included higher estimates of the amount of income proprietors fail to report to tax authorities.
“This shift in the rate is an income story, it is not a consumption story,” said David Wasshausen, head of the national income and wealth division at the Bureau.
The Bureau also revised down gross domestic product growth for 2017 from 2.3 to 2.2 per cent, with much of the reduction falling in the second half of the year.
The revisions moved GDP growth in the fourth quarter of last year down from 2.9 to 2.3 per cent, largely due to new estimates of business inventories and fixed investment.
$650bn
Extra proprietors income from 2012 to 2017
In the years 2012 to 2016, the Bureau made similar adjustments to quarterly GDP growth, with upward revisions in the first half of the year and downward revisions in the second half, in part due to updated seasonal adjustments.
Every five years, the Bureau issues a comprehensive update of the national income and product accounts, incorporating new measures of economic growth and estimates for price information.
The Bureau figures published on Friday indicated an extra $650bn of proprietors income from 2012 to 2017, or an average 8 per cent upward revision in each of those years. Proprietors income measures the profits made by sole proprietorships and partnerships.
The numbers drew on a tax gap study done by the Internal Revenue Service in 2016 and drove much of the upward revision in the savings rate.
The personal savings rate in the US has been on a long decline since the 1970s, a trend that began to reverse after the financial crisis. The figure is calculated by comparing the difference between disposable incomes and personal expenditures.
This latest update left the economic picture relatively unchanged in aggregate, with average annual GDP growth between 2012 and 2017 unchanged at 2.2 per cent.
The data showed an increase in technology investment, largely due to a better understanding of cloud computing supply chains. Bureau officials had “been a bit puzzled” about why some cloud computing investment appeared to be missing from the previous data, said Erich Strassner, head of its industry applications division.
He said the Bureau had carried out an analysis of global supply chains to understand the problem better and had reclassified certain imported servers and storage devices from intermediate inputs — or partially finished goods — to final, fixed investment related to cloud computing.
“The result of all this is going to be an upward revision to high-tech investment,” said Mr Strassner.

Apartment Construction Is Expected to Slow in 2018 After 6-Year Upward Streak

  • Almost 283,000 new apartments are expected for completion by the end of 2018, 11% less than last year.
  • Apartment construction peaked in 2017, finally slowing down in 2018.
  • In spite of the year-over-year slowdown, the past three years’ total deliveries are projected to pass the 900K mark by the end of this year – the highest since the mid-‘80s.
  • Continuing the trend seen in recent years, Texas is leading the nation with more than 37,000 units slated for delivery in 2018 in Houston, DFW, Austin, and San Antonio combined.
Following an almost decade-long period of vigorous expansion, the growth of the U.S. renter population has reached a plateau in 2016. Construction had continued to break records – until this year, when Yardi Matrix market data suggests that the total number of new completions is going to remain far below the 300K mark.
Compared to 2017 when the number of new deliveries reached an all-time high mark in the last 20 years, 2018 will see about 34,900 less deliveries ready to hit the market. The amount of new construction has followed a fast-ascending trend in the past 6 years, but the trend is estimated to change course this year. 2017 deliveries represented a new post-recession high, although actual apartment deliveries last year came short of initial estimates in many metros, due to increased construction costs and qualified labor shortage. As the market is approaching a saturation point, 2018 may mark the start of a construction cooldown for the next few years.
Apartments Delivered - yearly
On the other hand, carrying out a large-scale apartment project from the initial phases of planning to delivery rarely fits into a one-year timeframe. If we look at the combined delivery figures of 3-year periods, however, the past three years still top the output seen in three decades. Apartment construction has last peaked at 933K deliveries between 1983-1985 and is forecasted to reach an astonishing number of 910K deliveries by the end of 2018, the closest it’s come to that record-breaking performance ever since. Although the pace of construction has helped tremendously with supply, it’s still going to be a challenge for developers to keep up with the demand, taking into consideration the fact that the number of renters is on the rise.
Apartments delivered (1983-2018)

The average rent is still increasing, despite witnessing a much-needed deceleration

Rent growth has followed a path of ups and downs since the recession, but prices have not decreased since 2010 at a national level. It seems that 2017 brought a touch of relief with rent prices starting to slightly hit the brakes.
Yearly rent growth (2008-2018)
However, the national average rent has already seen a 2.3% increase during the first six months of this year, and whether or not it will outpace 2017’s 3.5% uptick by the end of the year is up to the market’s reaction time, as the slightly narrower pipeline has the potential to blow even that little wind out of the sails of renters. One thing’s for certain: the number of renters has been on the increase in the past years, and it’s unlikely to start decreasing as long as home prices are shooting up faster than rents.

New York metro leads the way with the highest number of units expected to be delivered this year

Home to roughly 20 million people, the majority of them being renters, New York metro will add a total of 19,948 new apartments in 2018, slightly less than the 20,682 from a year before. Considering that the metro has become home to almost 46,000 new residents in the last year alone, the housing market has a lot to catch up to in terms of available supply.
Dallas-Forth Worth metro, on the other hand, having added over 146,000 more people to its population, is expected to up its apartment supply by 17,132 new units. The metro is second only to New York in terms of apartment construction, outpacing other metros like Denver and even Los Angeles and Chicago. Dallas metro has seen a growth in job opportunities, with more and more people relocating to the region and ultimately driving up rents. In Dallas alone, rents have increased by 3.2% year-over-year with renters paying a monthly amount of about $1,200.
Texan metros like Dallas, Houston, Austin and San Antonio stand out with a total of 37,000 new units. Houston metro is, however, expected to deliver only 7,646 new units this year, considerably less than it did in the past two years.
Top 20 Metros - Most apartments delivered
It’s worth pointing out that expensive markets such as San Francisco, Boston, and San Jose metro are adding a low supply of new apartments to their inventories. San Francisco is adding less than 7,000 new apartments while Boston is counting on about 5,000 new apartments to be built. Moreover, San Jose is planning on adding about 4,500 new units. Seeing these numbers, there’s not much hope that rent prices might drop any time soon.
Right at the bottom of the list, we have Philadelphia with 4,368 units expected for 2018 and Tampa with 4,176 units. The low number of deliveries in Tampa might be due to the loss of jobs following the recession.

Long Island City is New York’s hottest neighborhood for new apartments

Continuing its streak in apartment construction, Long Island City still leads among New York’s most active neighborhoods as 2,100 new units are projected to be delivered in LIC in 2018. The top 3 also includes Williamsburg with 1,932 new apartments, and Downtown Brooklyn with 1,118. Planning to build 986 new units this year, Fort Green is followed by East Harlem with 764 new deliveries, Hell’s Kitchen with 698 and Lincoln Square with 651. Crown Heights also made the list with 368 new units projected to be delivered in 2018.
New York - Hottest Neighborhoods

Los Angeles adds a sizable chunk of over 4,000 new apartments to its inventory

The construction of new apartments in Los Angeles metro is expected to hit the 11,000 mark in 2018 –recording a 23% drop compared to the previous year. Developers in Los Angeles city alone are stepping up their game and planning to deliver 4,583 new apartments.
This comes as a response to the city’s high rent prices that have set off what we can call an affordable migration. Renters account for almost half of LA’s population and the current supply of apartments is simply not enough to help cool off rental prices. Unable to keep up with the rising rents, more and more people are leaving California and relocating to less expensive places in neighboring states.
Los Angeles Metro - Hottest Markets
As far as other cities within the metro are concerned, Anaheim is expected to add 946 new units while Glendale’s inventory will increase by 891 new deliveries.

Phoenix Metro: Phoenix, Tempe, and Chandler are the top three hottest markets for apartment construction

Besides affordable rent prices, those living in Phoenix metro have another reason to rejoice as developers are planning to build over 10,000 new apartments this year, 55% more than they did last year. The metro saw its population soar by 2% in the last year while job growth was also strong at 2.8%.
Phoenix Metro: Hottest Markets
Home to employers like JP Morgan Chase, UPS or Santander Consumer USA, Phoenix is seeing a boost both in its job market, as well as in its apartment construction. The city is planning on adding 4,152 new units by the end of the year, an increase from last year when it only delivered 2,316 new apartments.
Construction volumes will reach 1,915 new apartments in Tempe, 1,075 in Chandler and 1,030 in Scottsdale. Peoria, Gilbert, Glendale, and Mesa are expected to add only around 400-500 new apartments each.

Austin Metro: Austin and Round Rock take the lead in apartment construction

As one of the cities with the most robust apartment construction in the country, Austin is adding an impressive number of 5,758 new apartments by the end of 2018. As a result of the 19% increase in apartment construction, rents in the area have gone up by a shy 0.2% in the last year. The sizeable supply of apartments is pushing landlords to offer concessions such as months of free rent.
Round Rock is planning to deliver 796 new apartments this year but construction in the area has dropped by 8% compared to last year while the average monthly rent increased by 1.3%.
Austin Metro - Hottest Markets

Construction is reaching outstanding levels in both Denver metro and Sacramento metro

Upping its population by 1.3% in the last year, Denver metro is also boosting its apartment construction by a staggering 150% in 2018. The area is continuing the trend seen in recent years with the construction of 15,187 new apartments. The big increase in apartment construction is due to the fact that part of last year’s deliveries got pushed to 2018. In regards to this, Doug Ressler, senior analyst at Yardi Matrix added: “The latest employment numbers came in at 2.3% as Denver is experiencing a lack of construction workers for multifamily and competing with office developers for labor resources. This was combined with a 2017 Mid-year decline in occupancy from 95.8% overall to 94.9% at Year-end.
Construction-crazed Sacramento metro is hot on its heels, increasing its apartment supply by 143% in 2018 versus the previous year while New Orleans metro adds 85% more apartments.
Both Jacksonville metro and Phoenix metro are building over 50% more apartments this year compared to 2017. The metros are also among the top 10 with the highest population growth, therefore the increase in construction comes as good news for renters hoping to see prices cooling off.
As for what lies ahead at a national level, Ressler believes that since “the residential development pipeline has slowed, there won’t be as many new properties coming online. Vacancy is also increasing slightly because of the new apartment buildings coming online, particularly in the Sunbelt and the Southwest.”

2018’s Best and Worst Apartment Markets for New Deliveries

The table below contains new supply projected to come online in 2018, in 101 metropolitan areas across the U.S. The metros have been ranked from best to weakest in terms of number of new apartment completions, based on data estimates from Yardi Matrix. All metros containing less than 300 units or less than 2 properties have been eliminated from the ranking.