Housing Starts Increased Sharply to 1.631 million Annual Rate in May
From the Census Bureau: Permits, Starts and Completions
Housing Starts:
Privately‐owned housing starts in May were at a seasonally adjusted annual rate of 1,631,000. This is 21.7 percent above the revised April estimate of 1,340,000 and is 5.7 percent above the May 2022 rate of 1,543,000. Single‐family housing starts in May were at a rate of 997,000; this is 18.5 percent above the revised April figure of 841,000. The May rate for units in buildings with five units or more was 624,000.
Building Permits:
Privately‐owned housing units authorized by building permits in May were at a seasonally adjusted annual rate of 1,491,000. This is 5.2 percent above the revised April rate of 1,417,000, but is 12.7 percent below the May 2022 rate of 1,708,000. Single‐family authorizations in May were at a rate of 897,000; this is 4.8 percent above the revised April figure of 856,000. Authorizations of units in buildings with five units or more were at a rate of 542,000 in May.
emphasis added
The first graph shows single and multi-family housing starts since 2000 (including housing bubble).
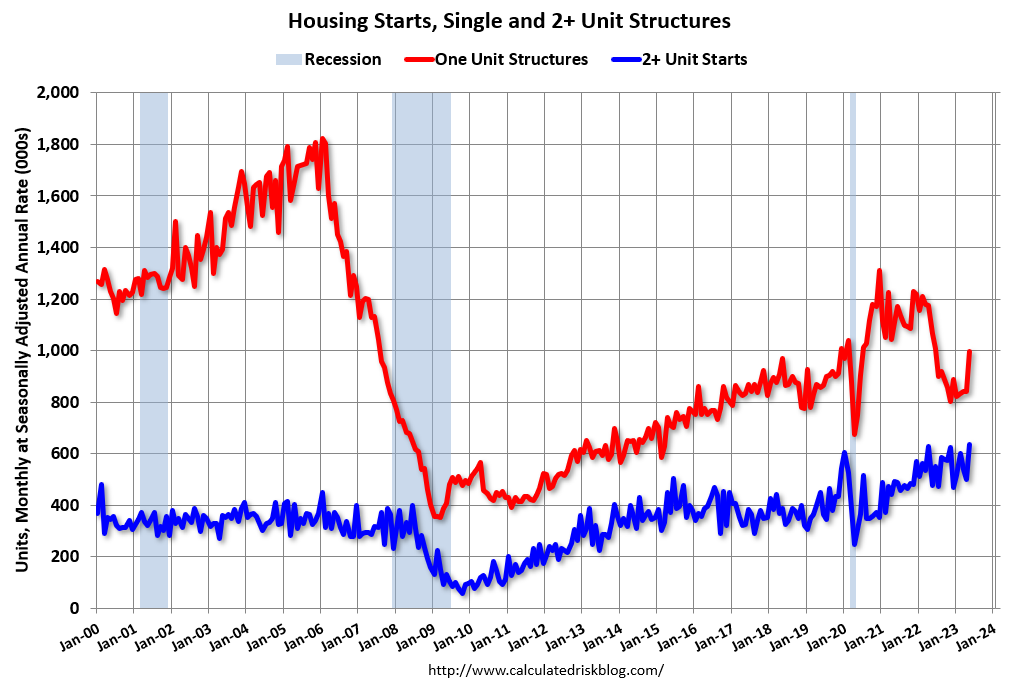
Multi-family starts (blue, 2+ units) increased in May compared to April. Multi-family starts were up 33.2% year-over-year in May. Single-family starts (red) increased sharply in May and were down 6.6% year-over-year.
Note that the weakness over the last year had been in single family starts (red).
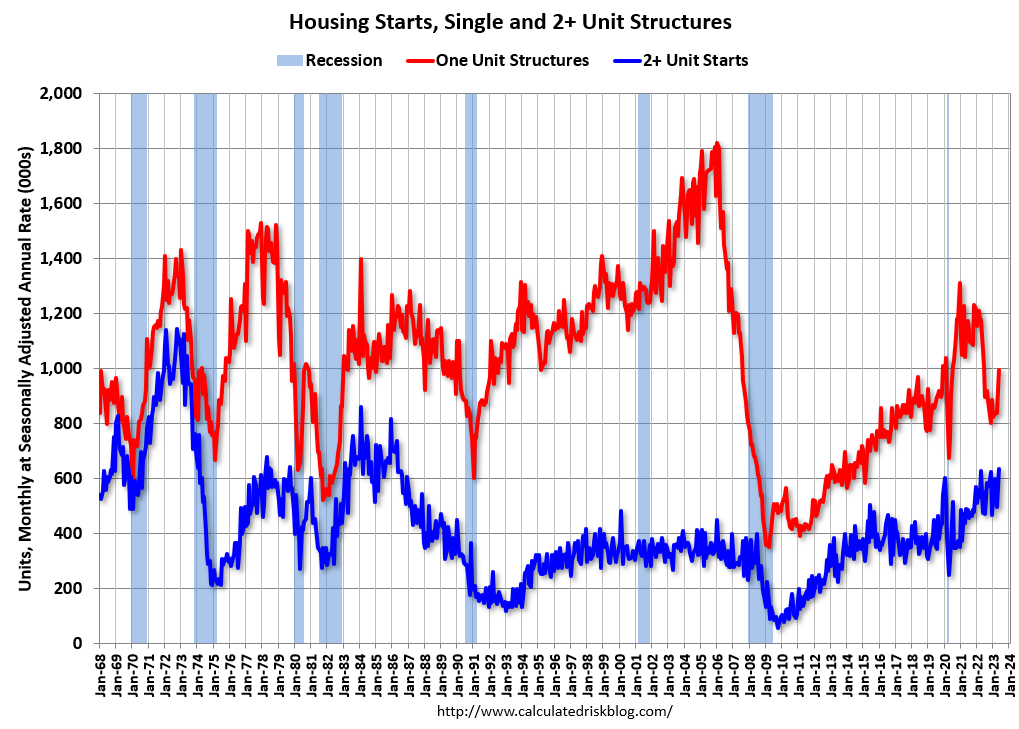
The second graph shows single and multi-family starts since 1968. This shows the huge collapse following the housing bubble, and then the eventual recovery - and the recent collapse in single-family starts.
Total housing starts in May were well above expectations, however, starts in March and April were revised down, combined.
The third graph shows the month-to-month comparison for total starts between 2022 (blue) and 2023 (red).
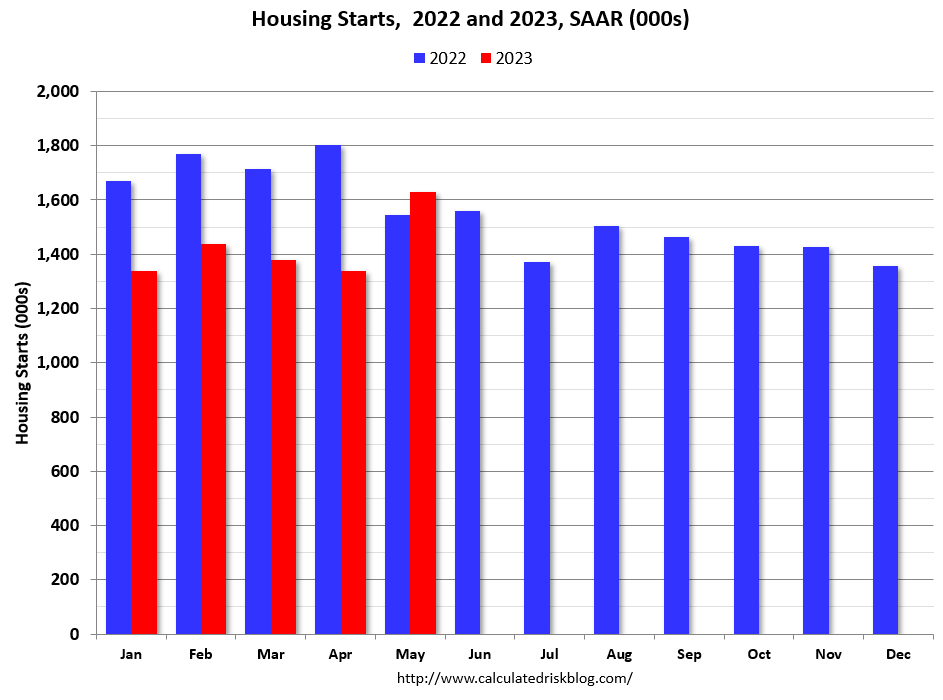
Total starts were up 5.7% in May compared to May 2022. Starts had been down year-over-year for twelve consecutive months, and I expect total starts to be down this year - although the year-over-year comparisons will be easier the rest of the year.
Record Number of Multi-Family Housing Units Under Construction
The fourth graph shows housing starts under construction, Seasonally Adjusted (SA).
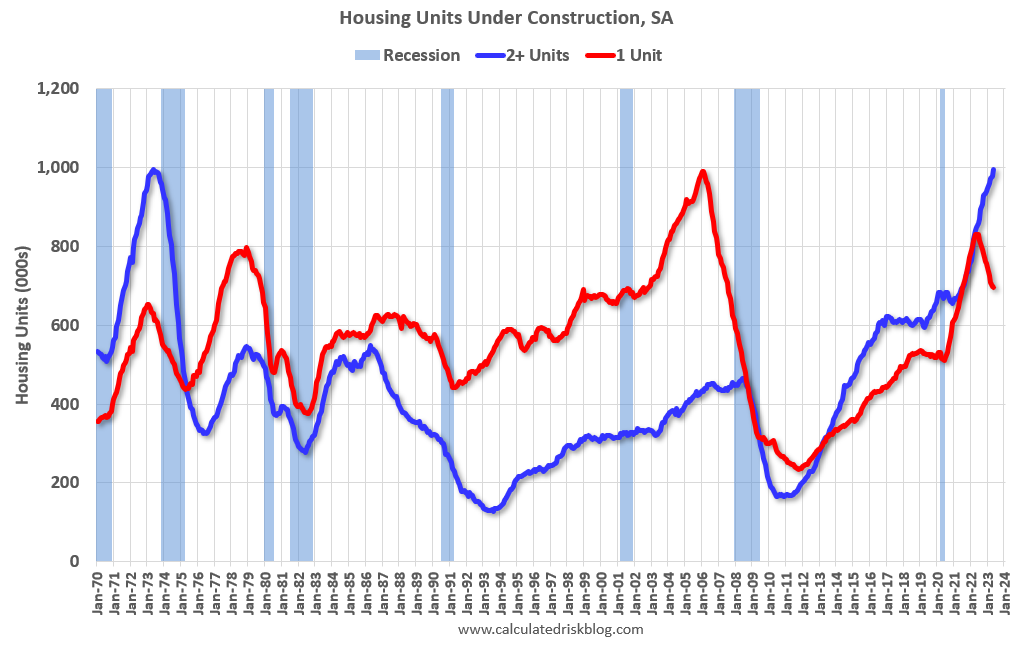
Red is single family units. Currently there are 695 thousand single family units (red) under construction (SA). This was down in May compared to April, and 136 thousand below the recent peak in May 2022. Single family units under construction peaked a year ago since single family starts declined sharply.
Blue is for 2+ units. Currently there are 994 thousand multi-family units under construction. This ties the record set in July 1973 of multi-family units being built for the baby-boom generation. For multi-family, construction delays are a significant factor. The completion of these units should help with rent pressure.
Combined, there are 1.689 million units under construction, just 21 thousand below the all-time record of 1.710 million set in October 2022.
Comparing Starts and Completions
Below is a graph comparing multi-family starts and completions. Since it usually takes over a year on average to complete a multi-family project, there is a lag between multi-family starts and completions. Completions are important because that is new supply added to the market and starts are important because that is future new supply (units under construction is also important for employment).
These graphs use a 12-month rolling total for NSA starts and completions.
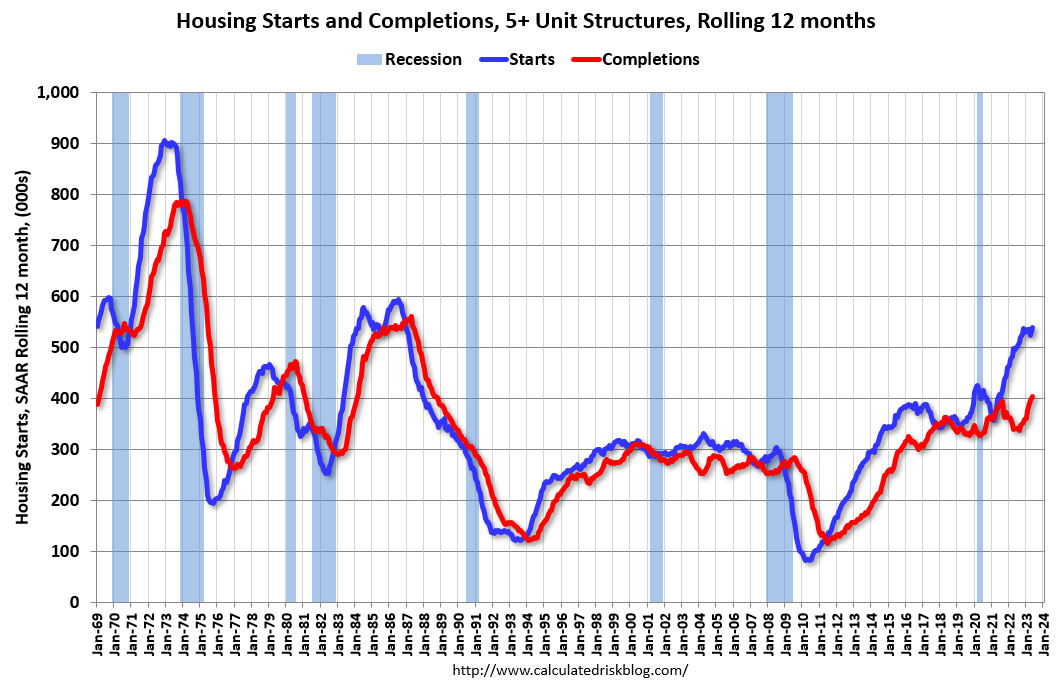
The blue line is for multifamily starts and the red line is for multifamily completions. Builders are still starting more multifamily units than they are completing. Multifamily starts (blue) picked up again, and completions (red) are increasing - and the gap is still huge.
The last graph shows single family starts and completions. It usually only takes about 6 months between starting a single-family home and completion - so the lines are much closer than for multi-family. The blue line is for single family starts and the red line is for single family completions.
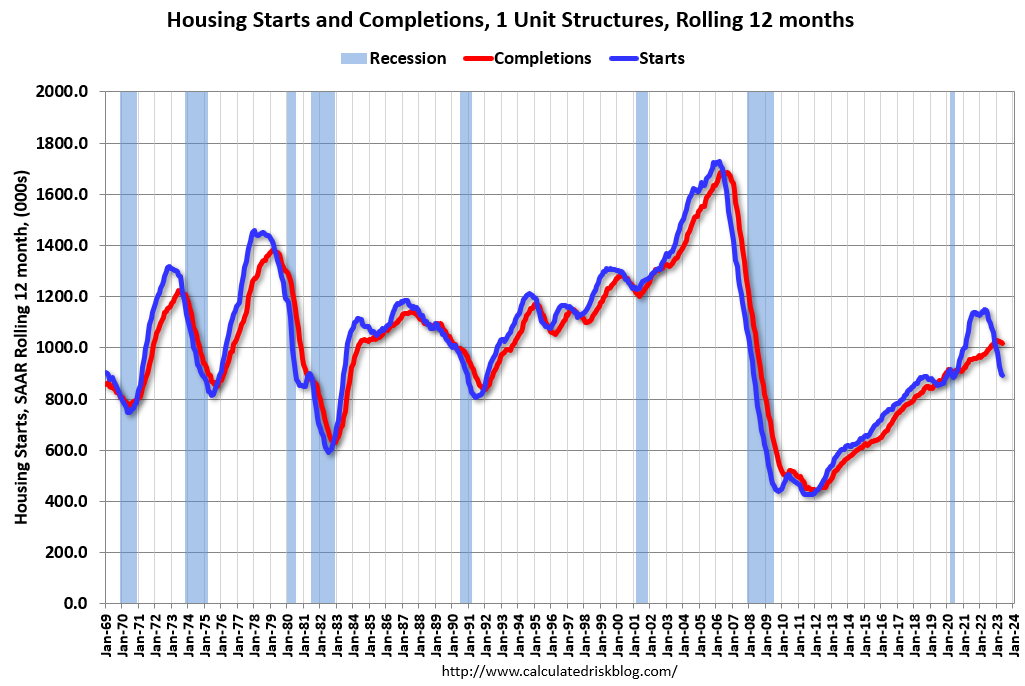
The recent gap between starts and completions has disappeared, and builders are now completing more single-family homes than they are starting on a 12-month basis. Completions are beginning to follow starts down.
Conclusions
Total housing starts in May were well above expectations, however, starts in March and April were revised down, combined. The weakness over the previous 12-months was in single family starts. However, single family starts have now picked up since there is limited existing home inventory.
I expect multi-family starts to turn down in 2023, but multi-family starts are continuing to surprise to the upside.
A record number of multi-family housing units are under construction due to construction delays, but the number of single-family housing units under construction is now declining. This suggests a large number of multi-family housing units will be delivered later this year and in 2024.
https://calculatedrisk.substack.com/p/may-housing-starts-record-number
No comments:
Post a Comment