The Census Bureau reports New Home Sales in October were at a seasonally adjusted annual rate (SAAR) of 632 thousand.
The previous two months were revised down.
Sales of new single‐family houses in October 2022 were at a seasonally adjusted annual rate of 632,000, according to estimates released jointly today by the U.S. Census Bureau and the Department of Housing and Urban Development. This is 7.5 percent above the revised September rate of 588,000, but is 5.8 percent below the October 2021 estimate of 671,000.
emphasis added
The first graph shows New Home Sales vs. recessions since 1963. The dashed line is the current sales rate.

New home sales are now below pre-pandemic levels. The second graph shows New Home Months of Supply.
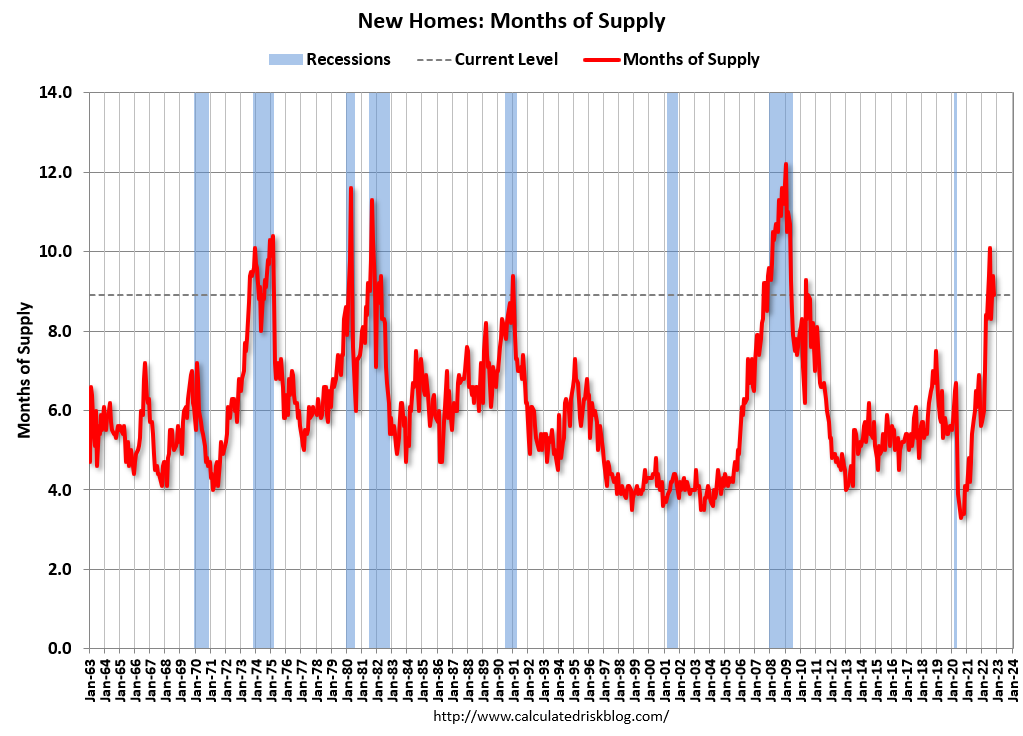
The months of supply decreased in October to 8.9 months from 9.4 months in September. The all-time record high was 12.1 months of supply in January 2009. The all-time record low was 3.5 months, most recently in October 2020. This is well above the top of the normal range (about 4 to 6 months of supply is normal).
"The seasonally‐adjusted estimate of new houses for sale at the end of October was 470,000. This represents a supply of 8.9 months at the current sales rate."
On inventory, according to the Census Bureau:
"A house is considered for sale when a permit to build has been issued in permit-issuing places or work has begun on the footings or foundation in nonpermit areas and a sales contract has not been signed nor a deposit accepted."
Starting in 1973 the Census Bureau broke this down into three categories: Not Started, Under Construction, and Completed.
The third graph shows the three categories of inventory starting in 1973.
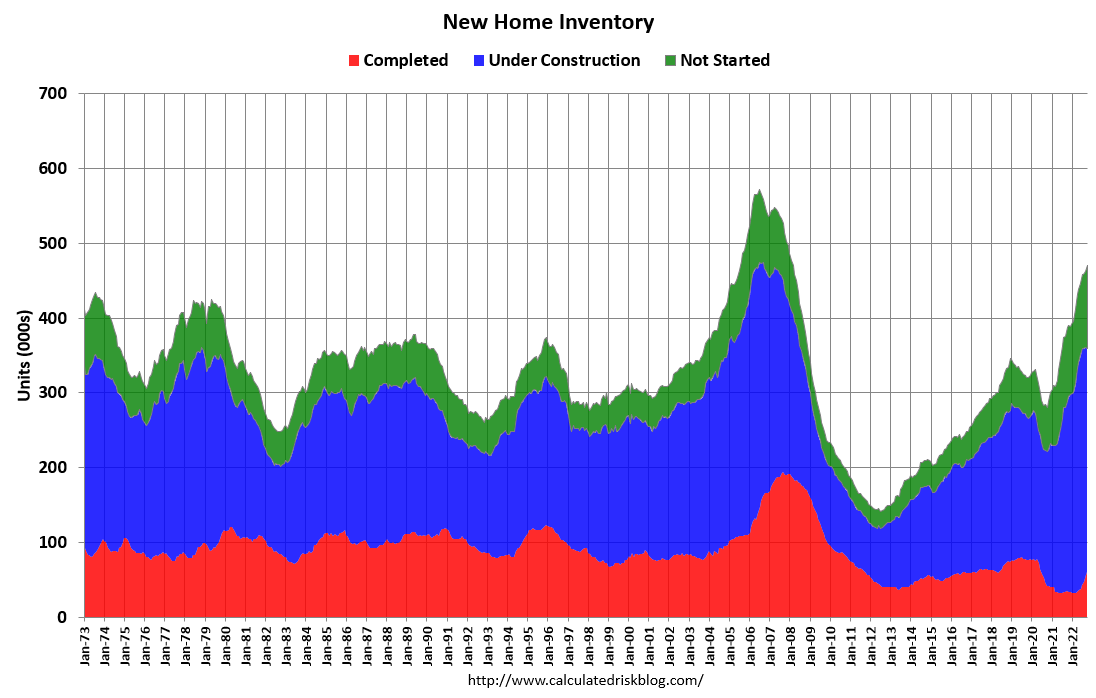
The inventory of completed homes for sale (red) - at 61 thousand - is up from the record low of 32 thousand in 2021 and early 2022. This is getting close to the normal level of completed homes for sale and increasing.
The inventory of homes under construction (blue) at 298 thousand is very high, and about 6% below the cycle peak in July 2022. The inventory of homes not started is at a record 111 thousand.
The fourth graph shows sales NSA (monthly sales, not seasonally adjusted annual rate).
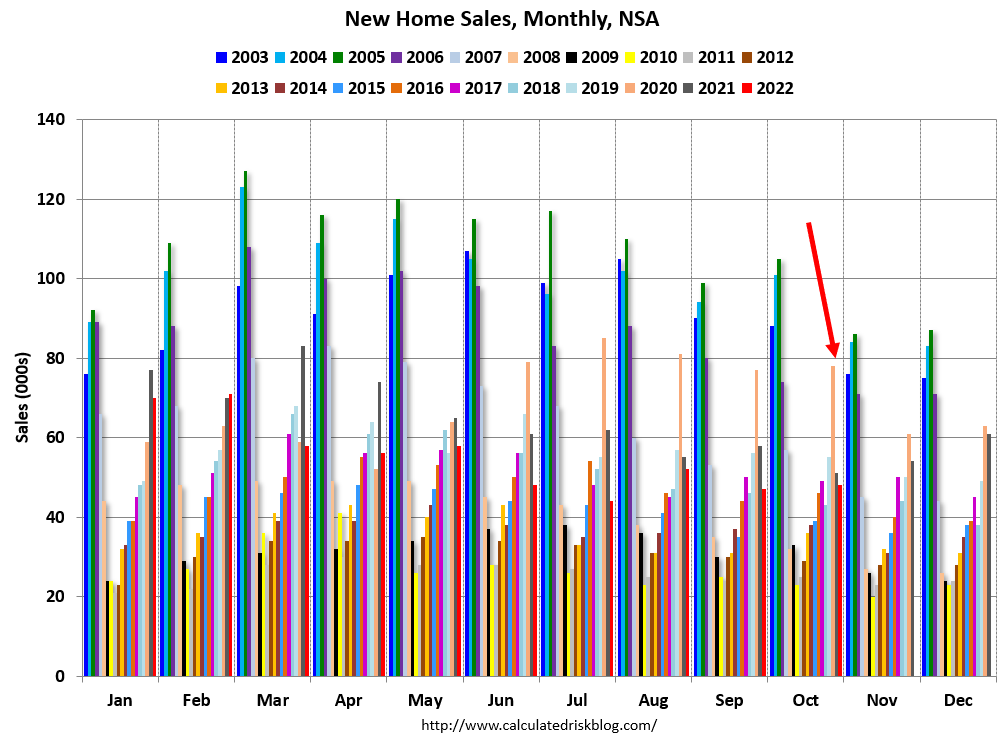
In October 2022 (red column), 48 thousand new homes were sold (NSA). Last year, 51 thousand homes were sold in October. The all-time high for October was 105 thousand in 2005, and the all-time low for October was 23 thousand in 2010.
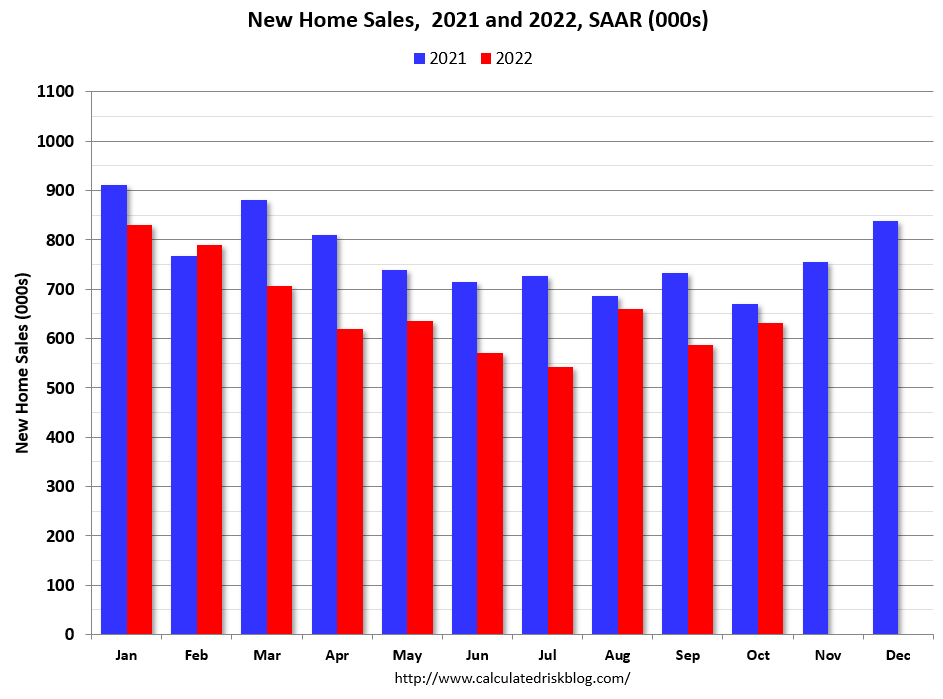
The next graph shows new home sales for 2021 and 2022 by month (Seasonally Adjusted Annual Rate). Sales in October 2022 were down 5.8% from October 2021. Year-to-date, new home sales are down 14.2% compared to the same period in 2021.
Six Months of Unsold Inventory Under Construction
The next graph shows the months of supply by stage of construction. “Months of supply” is inventory at each stage, divided by the sales rate.
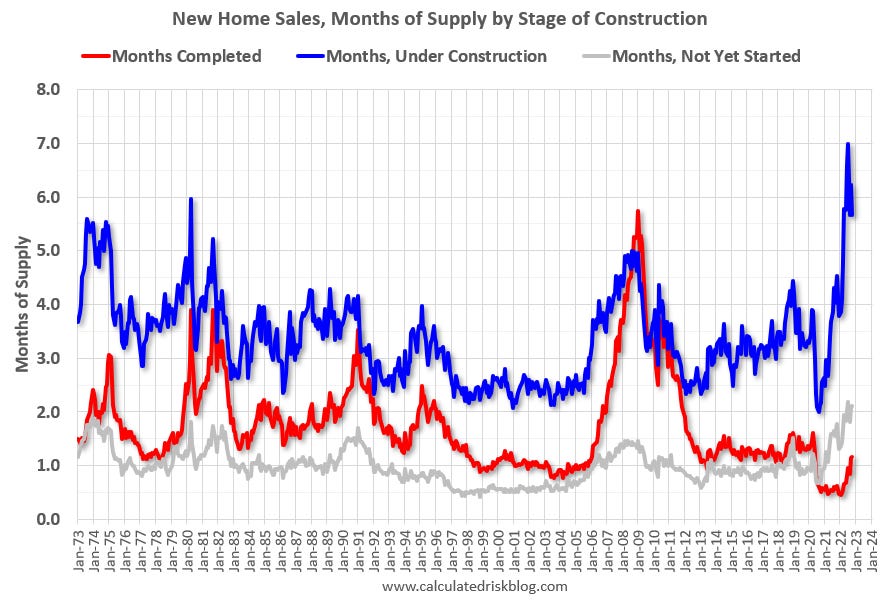
There are 1.2 months of completed supply (red line). This is getting close to the normal level.
The inventory of new homes under construction is at 5.7 months (blue line). This elevated level of homes under construction is due to supply chain constraints.
And a record 111 thousand homes have not been started - about 2.1 months of supply (grey line) - about double the normal level. Homebuilders are probably waiting to start some homes until they have a firmer grasp on prices and demand.
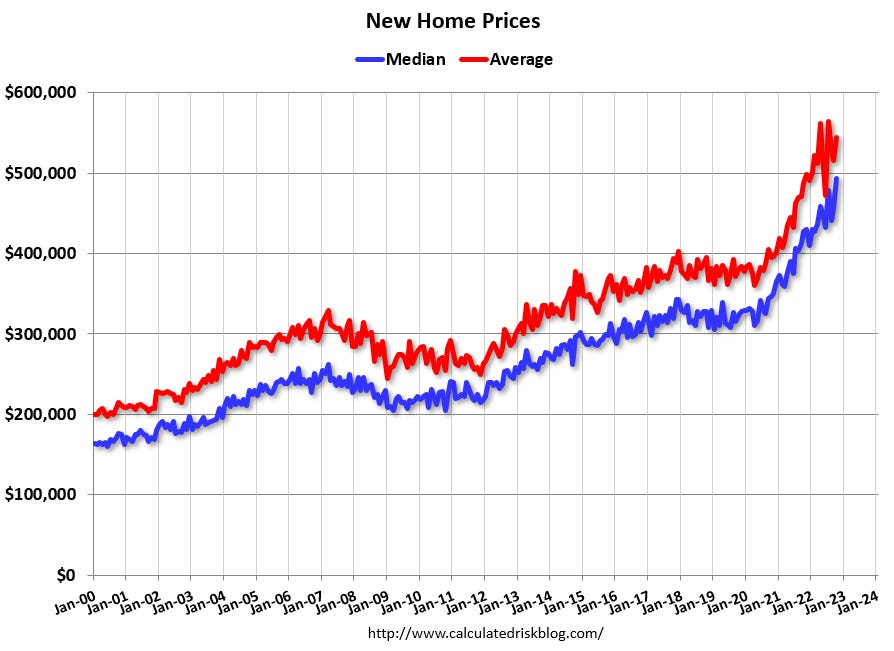
New Home Prices
And on prices, from the Census Bureau:
The median sales price of new houses sold in October 2022 was $493,000. The average sales price was $544,000.
The following graph shows the median and average new home prices. The average price in October 2022 was $544,000 up 15% year-over-year. The median price was $493,000 up 11% year-over-year. This suggests a slowdown in price increases, although both the median and the average are impacted by the mix of homes sold.
The last graph shows the percent of new homes sold by price.
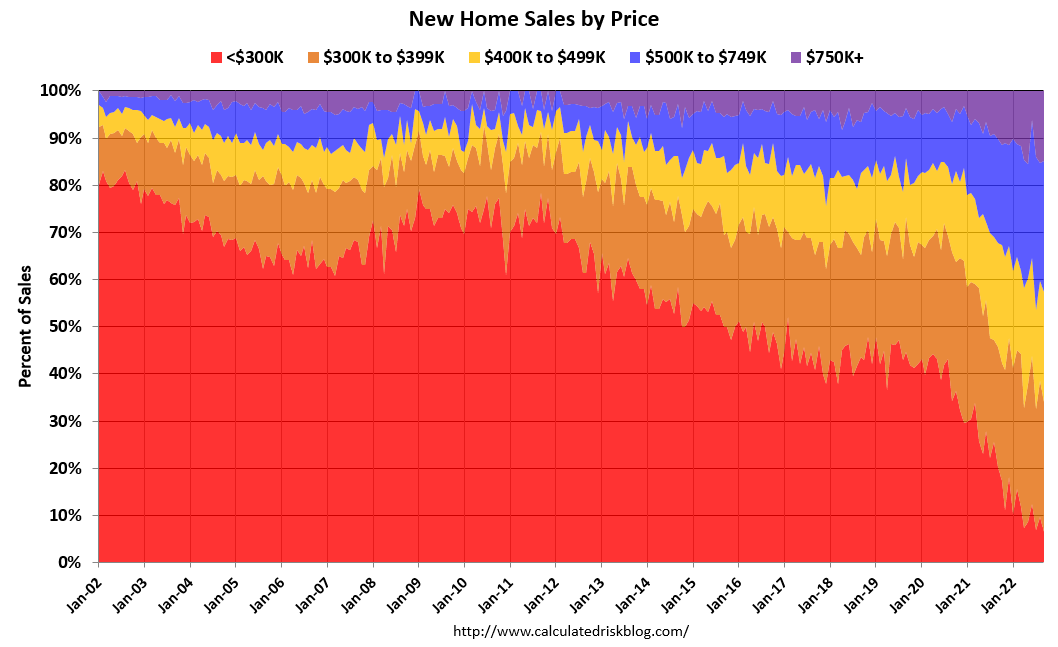
About 12% of new homes sold were under $300K in October 2022. This is down from around 80% in 2002. In general, the under $300K bracket is going away (inflation has pushed prices higher).
In October, we saw a decrease in the percent sales in the under $500K range (to 52%), and an increase in percent sales above $500K (to 48%).
Conclusion
First, as I discussed two months ago, the Census Bureau overestimates sales, and underestimates inventory when cancellation rates are rising, see: New Home Sales and Cancellations: Net vs Gross Sales. So, take the headline sales number with a large grain of salt - the actual negative impact on the homebuilders is far greater than the headline number suggests!
For example, on increasing cancellation rates, Rick Palacios Jr, Director of Research at John Burns Real Estate Consulting, tweeted yesterday:


There are a large number of homes under construction, and this suggests we will see a sharp increase in completed inventory over the next several months - and that will put further pressure on new home prices.
https://calculatedrisk.substack.com/p/new-home-sales-increased-in-october
No comments:
Post a Comment