Search This Blog

Saturday, July 30, 2022

Profits for Home Sellers Surge Again Across U.S. Amid New Round of Price Spikes in Q2

 Historical US Median Home Sales Prices Chart


Profit Margins on Typical Home Sales Hit Another Record, Rising to 56 Percent; Investment Returns in Second Quarter Rise at Fastest Pace in More Than a Decade; Median U.S. Home Price Up 9 Percent Quarterly and 15 Percent Annually, to New High of $346,000

 ATTOM, a leading curator of real estate data nationwide for land and property data, today released its second-quarter 2022 U.S. Home Sales Report, which shows that profit margins on median-priced single-family home and condo sales across the United States hit another new record of 55.5 percent following the largest quarterly gain in a decade.

On the heels of a lackluster first quarter of 2022 that suggested possible weakness in the nation’s long-running housing market boom, the latest typical profit margin was up from 48.3 percent in the first quarter of 2022 and 42.9 percent in the second quarter of 2021. It was more than 20 points above the 32 percent figure from the second quarter of 2020.

“Home sellers in the second quarter continued to benefit from the rapid growth in home price appreciation the country has experienced over the past few years,” said Rick Sharga, executive vice president of market intelligence at ATTOM. “While price growth may slow down as higher mortgage rates dampen demand from prospective homebuyers, home sellers should continue to profit from the record $27 trillion in homeowner equity in today’s market.”

While profit margins routinely go up during the Spring home-buying season, the latest spike of more than seven percentage points marked the largest quarterly gain since at least 2008. The year-over-year gain of 13 points in the typical return on investment was one of the largest in the past decade.

Gross profits also hit new highs in the second quarter of 2002, after dipping slightly in the early months of the year. The typical single-family home and condo sale across the country generated a gross second-quarter profit of $123,869, up 19 percent from $103,750 in the first quarter of 2022 and up 38 percent from $90,000 a year earlier.

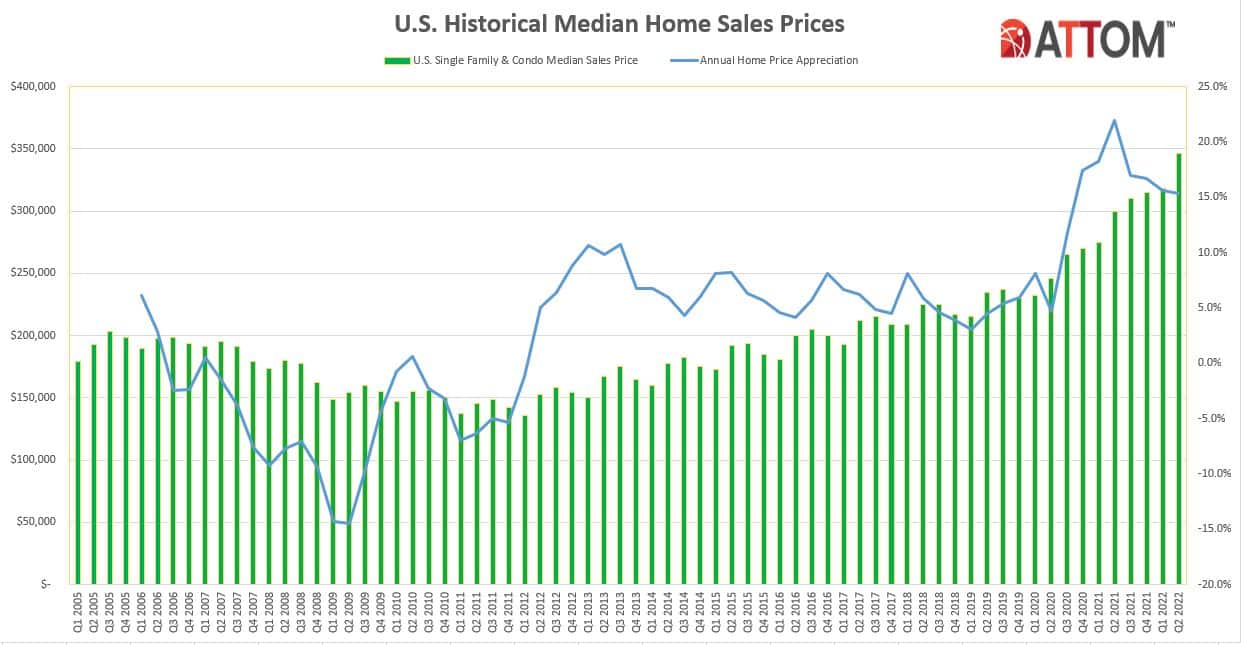
The second-quarter records for gross profits and profit margins came as the national median home price hit a new high of $346,000 in the second quarter of 2022 – the 10th straight quarterly increase. The latest median value was up 8.8 percent from the first quarter of 2022 and 15.3 percent from the second quarter of 2021.

The second quarter profit figures showed how strong the nation’s housing market prices remained despite rising economic uncertainty and home-mortgage rates that have surged this year. Average mortgage rates have nearly doubled from a year ago, reaching almost 6 percent for a 30-year fixed rate loan, making affordability a challenge for many potential homebuyers. These higher rates, coupled with rising home prices, the highest U.S. inflation rates in 40 years, and soaring food and fuel prices are all headwinds threatening to slow down what has been a white-hot housing market over the past few years. Still, home prices and seller profits surged anew in the second quarter, after a first quarter that saw a rare dip in investment returns.

Profit margins rise quarterly and annually across most of U.S.

Typical profit margins – the percent change between median purchase and resale prices – increased from the first quarter of 2022 to the second quarter of 2022 in 162 (89 percent) of the 183 metro areas around the U.S. with sufficient data to analyze. They were up annually in 174 of those metros (95 percent). Metro areas were included if they had at least 1,000 single-family home and condo sales in the second quarter of 2022 and a population of at least 200,000.

The biggest annual increases in profit margins came in the metro areas of Fort Myers, FL (margin up from 47.1 percent in the second quarter of 2021 to 90.9 percent in the second quarter of 2022); Naples, FL (up from 40.4 percent to 83.1 percent); Ocala, FL (up from 44.4 percent to 85.2 percent); Gulfport, MS (up from a loss of 6.5 percent to a gain of 30.8 percent) and Yuma, AZ (up from 42.7 percent to 77.8 percent).

The biggest annual profit-margin increases in metro areas with a population of at least 1 million in the second quarter of 2022 were in Orlando, FL (margin up from 36.4 percent to 67.6 percent); Tampa, FL (up from 47.4 percent to 76.3 percent); Miami, FL (up from 38.9 percent to 66.8 percent); Cleveland, OH (up from 21.4 percent to 42.1 percent) and Jacksonville, FL (up from 43.4 percent to 63.4 percent).

Profit margins decreased quarterly in just 20 of the 183 metro areas analyzed (11 percent) and annually in only nine metro areas (5 percent). The biggest annual decreases were in Salem, OR (margin down from 87.5 percent in the second quarter of 2021 to 55 percent in the second quarter of 2022); Hilo, HI (down from 140.8 percent to 110.5 percent); Boise, ID (down from 122.8 percent to 100.1 percent); Salisbury, MD (down from 57.1 percent to 48.6 percent) and Albany, NY (down from 35.4 percent to 28.3 percent).

The largest annual decreases, or smallest gains, in profit margins among metro areas with a population of at least 1 million came in Atlanta, GA (down from 48.9 percent to 42.8 percent); Sacramento, CA (up from 61.5 percent to 62.5 percent); San Francisco, CA (up from 81.5 percent to 83.1 percent); Washington, DC (up from 44.9 percent to 46.7 percent) and Boston, MA (up from 49.8 to 52.9 percent).

Prices up in almost every metro area around the U.S.

Median home prices in the second quarter of 2022 exceeded values from the prior quarter in 181 (96 percent) of the 183 metropolitan statistical areas with enough data to analyze and were up annually in 180 of those metros (96 percent). Nationally, the median price of $346,000 in the second quarter was up from $318,000 in the first quarter of 2022 and $300,000 in the second quarter of last year.

The biggest annual increases in median home prices during the second quarter of 2022 were in Gulfport, MS (up 55.3 percent); Naples, FL (up 36 percent); Lakeland, FL (up 35.7 percent); Fort Myers, FL (up 31.7 percent) and Port St. Lucie, FL (up 29.8 percent).

The largest annual increases in metro areas with a population of at least 1 million in the second quarter of 2022 were in Tampa, FL (up 29.3 percent); Orlando, FL (up 25.5 percent); Phoenix, AZ (up 25.3 percent); Nashville, TN (up 24.3 percent) and Charlotte, NC (up 24.2 percent).

Home prices in the second quarter of 2022 hit or tied all-time highs in 168 percent of the 183 metro areas in the report, including New York, NY; Los Angeles, CA; Chicago, IL; Dallas, TX, and Houston, TX.

The largest annual decreases, or smallest increases, in median prices during the second quarter of 2022 were in Toledo, OH (down 3.4 percent); Davenport, IA (down 2.7 percent); Peoria, IL (down 0.8 percent); Rockford, IL (up 2.1 percent) and Trenton, NJ (up 2.2 percent).

The smallest annual increases in metro areas with a population of at least 1 million in the second quarter of 2022 were in Honolulu, HI (up 4.4 percent); Buffalo, NY (up 5.5 percent); Virginia Beach, VA (up 6.3 percent); Rochester, NY (up 6.7 percent) and Baltimore, MD (up 7.4 percent).

ATTOM Chart on Median Home Sale Prices

Homeownership tenure remains historically low

Homeowners who sold in the second quarter of 2022 had owned their homes an average of 5.87 years. That was up from 5.71 years in the first quarter of 2022, but down from 6.31 years in the second quarter of 2021. The latest figure was the second-shortest average time between purchase and resale since the first quarter of 2012.

Tenure decreased from the second quarter of 2021 to the same period this year in 88 percent of metro areas with sufficient data. They were led by Lakeland, FL (tenure down 61 percent); Salem, OR (down 51 percent); Yakima, WA (down 30 percent); Provo, UT (down 27 percent) and Eugene, OR (down 24 percent).

Twenty of the 25 longest average tenures among sellers in the second quarter of 2022 were in the Northeast or West regions. They were led by Bellingham, WA (9.6 years); Manchester, NH (9.13 years); Honolulu, HI (7.82 years); Bridgeport, CT (7.76 years) and New Haven, CT (7.52 years).

ATTOM Chart on Homeownership Tenure

The smallest average tenures among second-quarter sellers were in Lakeland, FL (1.25 years); Memphis, TN (3.51 years); Tucson, AZ (3.79 years); Knoxville, TN (4.28 years); and Cleveland, OH (4.33 years).

Lender-owned foreclosures decline further to new low since 2000

Home sales following foreclosures by banks and other lenders represented just 1 percent of all U.S. single-family home and condo sales in the second quarter of 2022 – the lowest portion since at least the first quarter of 2000.

The latest portion of REO sales was down from 1.1 percent in the first quarter of 2022 and 1.5 percent in the second quarter of last year. REO sales represented only one of every 96 sales in the second quarter of 2022, a rate that was less than 1/30th of this century’s high point of one in three in first quarter of 2009.

Among metropolitan statistical areas with a population of at least 200,000 and sufficient data, those areas where REO sales represented the largest portion of all sales in the second quarter of 2022 included New Haven, CT (2.7 percent or one in 37 sales); Chicago, IL (2.7 percent); Syracuse, NY (2.7 percent), Mobile, AL (2.5 percent) and St. Louis, MO (2.3 percent).

Cash sales at eight-year high

Nationwide, all-cash purchases accounted for 35.4 percent of all single-family home and condo sales in the second quarter of 2022, the highest level since the first quarter of 2014. The second-quarter-of-2022 number was up from 34.6 percent in the first quarter of 2022 and from 31 percent in the second quarter of last year.

“Cash buyers have continued to account for a higher percentage of home sales than usual, probably due in part to homeowners selling properties in high cost states and using the proceeds to buy a home with cash in lower cost areas,” Sharga noted. “With mortgage rates almost doubling over the past year and the cost of financing soaring, cash buyers will be in an even stronger position of competitive advantage for the foreseeable future,”

Among metropolitan areas with a population of at least 200,000 and sufficient cash-sales data, those where cash sales represented the largest share all transactions in the second quarter of 2022 included Naples, FL (57.2 percent); Utica, NY (52.7 percent), Youngstown, OH (52.6 percent); Atlanta, GA (51.3 percent) and Salisbury, MD (51 percent).

Those where cash sales represented the smallest share of all transactions in the second quarter of 2022 included Gainesville, GA (5.1 percent of all sales); Athens, GA (14.4 percent); Lincoln, NE (16.2 percent); San Jose, CA (18 percent) and Des Moines, IA (18.1 percent).

Institutional investment rises

Institutional investors nationwide accounted for just 6.2 percent, or one of every 16 single-family home purchases in the second quarter of 2022. That was the same portion as in the second quarter of 2021, but up from 4.4 percent in the first quarter of 2022.

Among states with enough data to analyze, those with the largest percentages of sales to institutional investors in the second quarter of 2022 were Arizona (16.7 percent of all sales), Georgia (13.1 percent), Nevada (13 percent), North Carolina (9.9 percent) and Tennessee (8.9 percent).

States with the smallest levels of sales to institutional investors in the second quarter of 2022 included Maine (1 percent), New Hampshire (1 percent), Hawaii (1.2 percent), Louisiana (1.6 percent) and Vermont (1.6 percent).

ATTOM Chart on Home Sales by Type

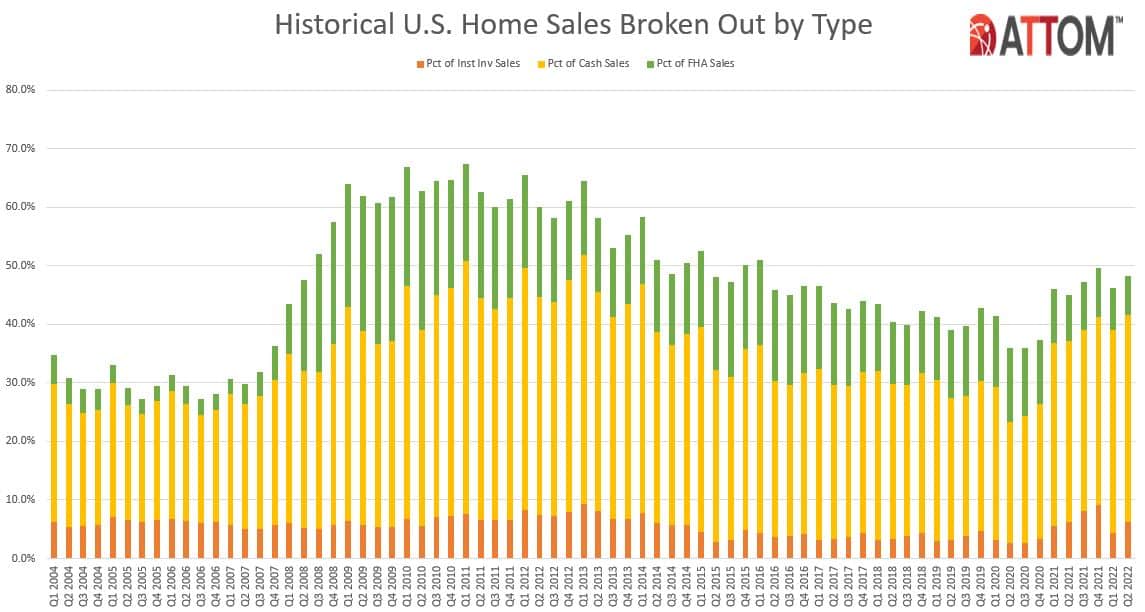
FHA-financed purchases at lowest level in almost 15 years

Nationwide, buyers using Federal Housing Administration (FHA) loans comprised only 6.7 percent of all single-family home purchases in the second quarter of 2022 (one of every 15), the smallest portion since the fourth quarter of 2007. The latest figure was down from 7.3 percent in the previous quarter and from 7.9 percent a year earlier.

“FHA borrowers – and borrowers with VA loans – have been at a significant disadvantage in a housing market characterized by historically short sales cycles and near-record levels of cash buyers,” Sharga added. “If days on market continue to increase, leveling the playing field a little bit for these borrowers, we could see the volume of homes purchased by FHA and VA borrowers climb back up to more normal levels.”

Among metropolitan statistical areas with a population of at least 200,000 and sufficient FHA-buyer data, those with the highest levels of FHA buyers in the second quarter of 2022 included Visalia, CA (18.6 percent); Bakersfield, CA (18.4 percent); Beaumont, TX (16.9 percent); Merced, CA (16.2 percent) and Shreveport, LA (15.6 percent).

https://www.attomdata.com/news/market-trends/home-sales-prices/attom-q2-2022-u-s-home-sales-report/

Amid Recession Fears, Economically Free States Continue to Outperform

 Florida Gov. Ron DeSantis recently responded to questions about California Gov. Gavin Newsom’s ads airing in Florida, "It’s almost hard to drive people out of a place like California given all their natural advantages, and yet they are finding a way to do it.” He noted that California is hemorrhaging its population because of bad progressive economic policies so that they could be more free

Florida ranks third in the nation for economic freedom, according to the Fraser Institute. And California ranks second to last.

Our own study supports the position of DeSantis.

Freer states that were more reluctant to shut down their economies due to COVID-19 are doing much better economically than states with severe shutdowns. Even a state like California is suffering — which was considered an American paradise for nearly a century, with its perfect weather and natural beauty.

This month’s U.S. jobs report showed an increase of 372,000 net nonfarm jobs in June, yet it’s still under the pre-shutdown number by 524,000. The Biden administration trumpeted the good news of job growth, yet the real story is in the details. Labor participation is lagging and inflation-adjusted average hourly earnings are declining, and the bulk of the new jobs added are decisively in lower-tax, pro-growth-oriented states.

Residents are fleeing California, New York, Illinois, and Pennsylvania for places like Georgia, Florida, Tennessee, and Texas. DeSantis noted that it was once unusual to see California license plates in Florida, but it’s now a growing trend.

Of the 14 states that have recovered all their jobs lost due to the shutdowns, 12 are in states with legislatures and governors, championing a better fiscal and regulatory climate. This supports lower costs of living that offer new residents greater purchasing power and better opportunities to weather a looming recession.

Perhaps the most important statistic is how Americans are voting with their feet.

Forty-six million Americans changed zip codes in a 12-month period ending in February 2022. That’s the most moves since 2010. According to the U.S. Census Bureau, in 2021, California, New York, and Illinois had the highest domestic migration losses, and Florida, Texas, and Arizona gained the most.

Pods, a moving and storage company, offers up their own data on where Americans are increasingly headed. Virtually every destination benefitting now is in the Southeast, Texas, or Arizona. Pods continually cites that people say the lower cost of living as a primary reason for relocation.

U-Haul released a report showing essentially the same results. And there are private research organizations as well with more corroborating evidence, such as How Money Walks that uses IRS data.

And it’s not just people that are moving but businesses, too.

In June, Caterpillar Inc., a Fortune 500 company, announced they are moving their headquarters from Deerfield, Illinois, where they have been since the early 1900s, to Irving, Texas. This makes Texas now the headquarters of 54 of the Fortune 500 companies in the world. Remington Firearms, America’s oldest firearms manufacturer, recently announced its relocation from New York to LaGrange, Georgia.

The list goes on and on.

Competition amongst states for residents and businesses is a booming trend that doesn’t look like it will abate soon. Undoubtedly, ad campaigns and recycled political rhetoric will ratchet up the fight on both political sides for new residents and commercial enterprises. Yet the policies of lower spending and taxes, deregulation, and stronger property rights resulting in more freedom are winning.

Prolonged COVID-19-related shutdowns and excessive government mandates proved to be a formula for economic destruction. The evidence in favor of economic opportunity and robust markets is overwhelming.

Fortunately, Americans are now seeing and acting on not only mounting evidence but also their own real-life experiences — which is the true test of which approach is more viable.

Vance Ginn is Chief Economist at the Texas Public Policy Foundation, and former Associate Director for Economic Policy of the White House’s Office of Management and Budget, 2019-2020. Erik Randolph is the Director of Research at the Georgia Center for Opportunity.

https://www.realclearpolicy.com/articles/2022/07/27/amid_recession_fears_economically_free_states_continue_to_outperform_844604.html

No vacancy at the warehouse

 Warehouses across the U.S. are filled to the rafters, and another wave of imports is coming soon as retailers stock up for the holiday peak season. That puts most companies in a pinch as they look for ways to deal with the extra inventory.

Conventional wisdom says that retailers can simply move their goods from expensive coastal distribution centers to cheaper rural locations or ship them directly to brick-and-mortar stores, “forward positioning” the inventory closer to consumers. But nothing comes for free in logistics; in practice, every option comes with its own costs and challenges.

For example, warehouse space is hard to find anywhere right now, thanks to soaring demand during the pandemic rebound. And even if you can find space, good luck paying for the truck to get your goods there; freight costs are higher than ever, thanks to rising fuel costs and tight capacity.

The conflict is real. A survey released in June by the shipping and mailing services provider Pitney Bowes showed that big retailers are now offering widespread discounts to shoppers as a way to draw down their inventory. “This summer will present both new challenges and new opportunities for brands,” Vijay Ramachandran, VP market strategy, global e-commerce at Pitney Bowes, said in a release announcing the survey’s findings. “Overstocks and markdowns will impact profitability but also create new openings to sell, as a large portion of consumers seek out deals—further aided by the return of [Amazon’s] Prime Day and other mid-year promotions. At the same time, our survey found a growing number of consumers cutting back on retail spending altogether as they react to record inflation and gas prices, and rising interest rates.”

Caught in a vise between rising stocks and slowing consumption, companies have to be more precise than ever in balancing the costs and benefits of carrying inventory, says Steve Denton, CEO of Ware2Go, a third-party fulfillment services provider that is owned by UPS Inc.

Waiting out the storm is not an attractive option, either. “The cost of storage is higher than [it was] a couple years ago because of the lack of warehouse space,” Denton says. “That means the margin evaporates if you carry [inventory] too long.”

FINDING NEW MARKETS

As for how companies can clear out some of that overstock, Denton urges them to explore new sales channels beyond the classic options of direct to store (DTS) and direct to consumer (DTC). For many merchants, an easy option is to liquidate their goods by selling them on a secondary market—such as Overstock.com or T.J.Maxx—or to sell them to the giant online retailer Amazon. 

However, Denton points out that even those options carry some costs, such as the extra labeling compliance costs required of “Amazon 1P”—or first-party—partners (meaning companies that sell their products directly to Amazon, which then sells them to consumers). Choosing the “Amazon 3P”—or third-party—option could cost even more, since only the digital sale itself occurs on the Amazon marketplace in that model, leaving merchants to take care of order fulfillment and shipping themselves.

As companies fight their way through the thicket of rising inventory management costs, many are turning to a middle ground between the in-store and online models, using their stores as small DCs. That’s where software analytics has become an important tool for balancing the strengths and weaknesses of the purely warehouse and retail sites, says Amy Tennent, senior director for product management at Manhattan Associates, a supply chain software developer.

As Tennent explains, the “simple” decision to forward-deploy goods to a retail store actually represents a potential minefield. In theory, stockpiling goods at stores should shrink a retailer’s shipping costs by enabling practices like “buy online/pick up in store” (BOPIS) or minimizing shipping distances for items sent to consumers, she says. In pursuit of that goal, some companies create “mini fulfillment hubs” within some of their retail sites, then task their store employees with picking and packing orders for home delivery.

However, that strategy may have drawbacks because managers at each location must decide how much store labor to devote to e-commerce fulfillment work, as opposed to serving customers in the showroom, says Tennent. Make the wrong choice, and parcel shipments could be backlogged for days, or impatient customers could walk out of the store. “You need to identify specific labor assigned to the job, otherwise your store team will have to [fulfill online orders] while also serving customers,” Tennent says. “If they get only two or three orders a shift, then store associates can do it just fine. But if it’s 50, 100, or 150 [orders], then they need the right tools in place: pick-path optimization, batch picking, prioritizing orders, sorting and staging the products after picking, and a packing station.”

Generally speaking, the retailers most likely to benefit from forward-deployment strategies are those that are able to assign committed resources to the task, Tennent says. Ideally, that would mean deploying a dedicated labor force for every shift, using cloud-based software like supply chain management and warehouse management systems to balance all the variables.

JUMPING IN WITH BOTH FEET

When it comes to inventory-balancing technology, retailers have other tools at their disposal as well. Another type of software for the job is an order management system (OMS), a critical tool for coping with overstocks in any location, says Carson Krieg, industry solutions + strategy, last mile, at project44, a provider of freight data and supply chain visibility solutions.

Typically, the best results come when a retailer has both OMS software and a limited number of stock-keeping units (SKUs), he says. That combination allows companies to choose the most efficient option. Three common choices are: 1) to deploy inventory to multiple microfulfillment centers (MFCs) that are dedicated to shipping orders; 2) to rent short-term shared warehouse space through a marketplace like Flexe, Flowspace, or Stord; or 3) to use their own brick-and-mortar locations in the local market and implement a ship-from-store strategy.

But of course, not every company is able to take full advantage of those options; many lack the necessary software or have an extensive product catalog. “If the retailer has a [large] number of SKUs, it may not benefit [it] to implement an MFC strategy due to the storage costs in local markets. It will depend on the maturity of [the retailers’] pick, pack, and ship processes and their cost to stock additional forward inventory,” Krieg says.

When it comes to clearing out their overstocked warehouses and reining in their storage costs, companies today have more choices than ever before. Among other options, they can ease the pressure by turning to liquidation websites, Amazon partnerships, shared warehouse space, and hybrid retail/DC facilities.

Choosing among those options may not be easy, but with the right logistics partners and finely tuned software, warehouse leaders can realistically assess the costs and benefits of every choice. No option offers a silver bullet, but experts say that strategies abound for managing the nation’s inventory glut.

https://www.dcvelocity.com/articles/55138-no-vacancy-at-the-warehouse

Friday, July 29, 2022

One Abandoned NYC Block Is 'Frozen' In Peak-Pandemic Time

 Life in most places is making an attempt to move forward from the pandemic lockdowns. But for one city block in New York, that isn't the case.

Outside of the 59th Street subway stop, across Lexington Avenue, Bloomberg writes you can still find an entire block "frozen" in peak-pandemic time. 

The area, which used to be prime New York real estate, was formerly the home of Banana Republic, the Gap and Victoria's Secret. Now, all people see are signs trying to find tenants for the empty buildings. 

Steve Soutendijk, an executive managing director at Cushman & Wakefield, told Bloomberg: “It’s probably the slowest market to return to pre-Covid levels out of any in New York City. It’s a little bit of a mystery.”

This block is a microcosm of how slow the city has been to recover, post-lockdowns, the report says. It was also suffering heading into Covid, with ridership exiting at 59th Street "declining for years" and businesses starting to select other parts of the city in favor of occupying the block. 

Now, ridership at the "Bloomingdale's Area", as brokers call it, and the 59th Street stop is down 50% since 2014. The department store used to be the big draw in the neighborhood, which would then act as a feeder for smaller retail shops in the area.

But as online shopping has gained in prominence and since the pandemic severed off a large portion of the local businesses, the department store is "no longer the anchor it once was", the report says. 

Michael Hirschfeld, a vice chairman at real estate firm Jones Lang LaSalle, said: “It’s a model of shopping that’s not entirely in favor at the moment.”

Help from tourists has also waned, with international visitors only expected to reach 60% of pre-Covid levels this year, the report says. 

But walking traffic is on the rise, the report says. More people are walking down that block than they did when the retail space was occupies in 2019, the report says, citing cell phone tracking data. Foot traffic in the area is outpacing other surrounding areas.

Maybe that's why Soutendijk can't help but shed a little optimism. He concluded: “I don’t think these spaces are staying vacant forever.”

https://www.zerohedge.com/markets/one-abandoned-nyc-block-frozen-peak-pandemic-time

Not a National Model—a National Warning

 California’s natural beauty and balmy climate are the envy of every state. Yet a strange thing has happened over the last two years: for the first time in state history, California has begun to shrink.

You wouldn’t know it from Governor Gavin Newsom’s air of public confidence. In the last few weeks, Newsom accepted a national award for education transformation and ran political ads to warn Floridians that their freedom is under attack. In both cases, he offered California’s progressive model as the right fit to reform the rest of America.

But his proud rhetoric doesn’t match California’s declining reality. Americans are voting with their feet to reject Newsom’s California model and heading to the very states that he criticizes.

The central plank of Newsom’s education transformation has been, in essence, to leave poor kids behind. California ranked last of all states in reopening schools after the pandemic, and the poor suffered the most. A study by Harvard economists finds that in states like California, where remote instruction was more common during the pandemic, high-poverty schools spent an additional nine weeks in remote instruction compared with low-poverty schools. In contrast, states like Florida and Texas had much lower rates of remote instruction, and smaller differences in its overall use between high- and low-poverty districts.

Brookings researchers have also demonstrated how school closings and remote learning hurt poor students. They showed that national “test-score gaps between students in low-poverty and high-poverty elementary schools grew by approximately 20% in math and 15% in reading.” The gap grew fastest in California.

Instead of a national model, Newsom’s California is a national warning of what happens when the progressive education establishment captures a state.

The political ads Newsom ran in Florida reveal perhaps an even greater disconnect between his rhetoric and California’s reality. Newsom warned Floridians that freedom “is under attack in your state,” and urged Florida residents to “join the fight, or join us in California where we still believe in freedom.” Newsom’s messaging turns gaslighting into a political strategy. If California believes in freedom, it has an odd way of showing it. After years of mask mandates, school closures, and pervasive lockdowns, Californians must be wondering what limits exist on state government intrusion into their lives. Nonetheless, they can’t help but notice the newfound freedoms that criminals and street homeless have enjoyed in cities like San Francisco and Los Angeles, where the rule of law has eroded at the hands of activist district attorneys.

Meantime, Californians who vote with their feet are fleeing to Florida in record numbers. From 2010 to 2018, California lost an average of 1,000 people to Florida per year, according to IRS taxpayer migration data. Then, from 2018 to 2019, California lost 4,800 residents to Florida. And from 2019 to 2020—the first IRS data that cover the early pandemic months—California lost 11,500 residents to Florida.

California’s outmigrants are bringing lots of income with them. The state shed an average of $270 million of annual income to Florida from 2010 to 2018. The annual loss jumped to $1.2 billion from 2018 to 2019, and then to $2 billion in 2019–2020. California’s losses, and Florida’s gains, have almost certainly accelerated in the intervening years. And Florida is not the only state picking up California exiles. The Golden State’s losses are at or near record levels with other states, too—in particular, states like Texas that Newsom targets with criticism.

Newsom wants Americans to believe that he has it figured out in California, and that the new American model for freedom is a progressive one. Yet his state’s aggressive population pivot has coincided almost precisely with his tenure as governor, making Newsom the first California leader to preside over a shrinking state rather than a growing one.

No amount of political rhetoric can mask California’s reality under Governor Newsom. Low-income students are being left behind, the rule of law is eroding, and residents are leaving in record numbers. The many former Californians watching Newsom’s ads in Texas and in Florida can only marvel at the hubris of the man.

https://www.city-journal.org/gavin-newsoms-california-is-a-warning-not-a-model

Thursday, July 28, 2022

NYC plans to fight rat problem by limiting hours trash bags can sit on streets

 The Department of Sanitation wants buildings and businesses to put their garbage bags out later in the evening as part of an effort to trash the city’s rat problem, The Post has learned.

The DSNY is planning to require that refuse bags be put out on sidewalks starting at 8 p.m. — which is four hours later than the current 4 p.m. garbage time.

The only exception will be trash that is stored in a can or bin, which will be allowed to be put out at 6 p.m., under the proposed rules.

“New Yorkers put millions of pounds of trash and recycling on the street starting at 4 PM – right as the evening rush is getting underway – and then it stays out, serving as a nightclub for rats and other pests, until it’s collected. Well soon, we’re going to try to shut the club down,” DSNY spokesman Joshua Goodman told The Post.

In light of the later time for garbage to be put out, the DSNY will be having more garbage picked up on the midnight shift, sources said.

The Big Apple’s current 4 p.m. set-out time for trash bags without a container requirement is the earliest deadline compared to other major cities’ requirements – including Boston, Philadelphia and Los Angeles.

NYC garbage
The Department of Sanitation is planning to require businesses and buildings to put out their trash bags starting at 8 p.m. instead of 4 p.m. in order to solve New York City’s rat problem.
Helayne Seidman

The rule change itself could take up to six months as the approval process requires DSNY to submit draft regulations to the City Record. A public comment period would then follow ahead of the final greenlight.

“Clean streets are essential to the City’s recovery, and between these changes and our five-borough containerization pilot, we’re lathering up to shave New York’s 5:00 shadow of trash bags,” said Goodman.

Goodman also said the idea came straight from the top – Mayor Eric Adams and DSNY Commissioner Jessica Tisch – and Tisch has been busy pitching the idea to the business community. 

She had a private meeting with members of the Real Estate Board of New York Wednesday afternoon to go over the plan. 

NYC trash
The only exception to the garbage time change would be if the trash is stored in a can or bin. If so, it could be put out at 6 p.m. under the proposed rules.
Paul Martinka

But over the last several months, DSNY started picking up more trash on the midnight to 8 a.m. shift. 

That accounts for five million pounds of trash and recycling scooped up under cover of darkness, compared to the same amount that was collected between 6 a.m. to 2 p.m. before the shift. 

That’s out of the 24 million pounds that trucks pick up daily, according to DSNY.

New Yorkers have been complaining about smelly streets. Records show calls to 311 reveal that outdoor odor complaints are at an all-time high after rising 54 percent — to 5,746 through June 30.

NYC trash
Outdoor odor complaints in New York City are frequent and have risen 54 percent through June 30.
Paul Martinka

Eugene Wilson, 55, owner of Manhattan restaurant “Pig N’ Whistle” at 58 West 48th St., told The Post he liked the idea.

“I’ve been here at this location 30 years and I can tell you the later the bags go out, the better! The smell on the street in the summer effects the whole block. And believe me, it’s not conducive to enjoying outdoor dining. People don’t need to be seeing it or smelling it on their commute home. 

“If they’re closing earlier I understand but food waste, it really should be later. We put it out at midnight but some of the other guys on the block put it out at 4 or 5.”

But not everyone cheered the proposal.

NYC trash
Some business owners have issues with the proposal because of staffing issues, a lack of bins and sanitary issues.
Robert Miller

“We don’t use bins and it would still be the same staffing issue so, it doesn’t matter. Won’t work for us,” Tim Flynn, 31, superintendent of The Delegate condo building on 301 E 45th Street, told The Post.

“We can’t wait until 8 o’clock?! We don’t have people to do that! The doorman is the only one here after 4 and he’s gotta stay on the door.  This will be a sanitary issue. No trash is kept in a air conditioned room.”

The city’s record-busting $101 billion budget allocated $22 million in new funding for rat-proof trash bins earlier this year and DSNY returned to five day a week street cleaning on July 5.

It’s a restoration of funds after ex-Mayor Bill de Blasio slashed the department’s budget during the COVID-19 crisis, which led to an overflow of complaints about city litter baskets.

https://nypost.com/2022/07/27/nyc-plans-to-fight-rat-problem-by-limiting-hours-trash-bags-can-sit-on-streets/

Tuesday, July 26, 2022

North Carolina City is the No. 1 Place for Glamping in America

 If you enjoy spending time in the great outdoors in North Carolina, but don’t want to squat behind a tree when nature calls, this list is for you.

Upgraded Points analyzed 100 cities across the country to find the top glamping destinations. Data was collected on 13 different weighted factors within three main categories: accommodation, recreation, and climate. Among them were hiking trail mileage, treehouse Airbnb listings, and natural hazard risk scores.

volume_off
-0:51
sd
fullscreen
Auto (360p)
225p
360p
Subtitles Off
Hank Williams Jr.'s Wife Mary Jane Thomas' Cause of Death Confirmed By Coroner 4 Months After Death
The former model died in March of a collapsed lung that was punctured during surgery, according to an autopsy report.
Pippa Middleton Chose a Classic Name for Her Baby Girl — with a Connection to Lilibet!
Arts and entertainment |
 
0:57
Hank Williams Jr.'s Wife Mary Jane Thomas' Cause of Death Confirmed By Coroner 4 Months After Death
-- |
 
1:28
Maine 7th Grader Who Loved Animals Is Found Slain in Home, and Minor Who Knew Her Is Suspect
-- |
 
1:20
Bindi Irwin Debuts Short Haircut in 24th Birthday Snaps with Family, as Brother Shares Throwback
-- |
 
1:54
Woman Hospitalized After Being Stabbed by 100 Lb. Sailfish During Florida Fishing Excursion
-- |
 
1:07
Calif. Teen with Autism Died After Being Restrained for More than an Hour, 3 School Employees Indicted
-- |
 
1:34
Mysterious Deaths of Rhode Island Couple Found Slain with Kids Home Was Actually Murder-Suicide: Police
-- |
 
0:59
Florida Teen Hospitalized Due to Brain-Eating Amoeba Following Family Beach Trip
-- |
 
1:13
Jennifer Lopez and Ben Affleck Jet Off to Paris After Tying the Knot at Las Vegas Chapel
-- |
 
0:48
Paul Sorvino, Prolific Goodfellas Actor and Tony Nominee, Dead at 83
Arts and entertainment |
 
0:51

So which North Carolina city ranked number one in all of the United States? I bet you could guess. Check out the top ten cities for glamping below.

  • 10. Boulder, Colorado

  • 9. Lake Tahoe, California

  • 8. Atlanta, Georgia

  • 7. Santa Cruz, CA And Scottsdale, AZ


  • 6. Colorado Springs, Colorado

  • 5. Spokane, Washington State

  • 4. Chattanooga, Tennessee

  • 3. Austin, Texas

  • 2. Las Vegas, Nevada

    The Sin City of Las Vegas ranks second with a city score of 34.76 out of 50.00. If you want to avoid the expensive Las Vegas Strip, opt for a glamping stay, which is priced on average at $136 per night. Relax for the weekend at Neftali’s tent which is situated on its own private mountain, complete with over 10 miles of hiking trails and anti-gravity chairs for stargazing at night.

  • 1. Asheville, North Carolina

    Asheville, North Carolina, ranked first as the best city for luxury glamping with an overall city score of 41.08 out of 50.00. This area has a whopping 600 glamping listings on Airbnb and 539 miles of hiking trails nearby. Book one of Asheville glamping’s star dome tents that features a skylight roof for stargazing at night and unwind before bed with a dip in your private hot tub out back.


    • AirBnB's With Glamping

      AirBnB's with Glamping

  • https://kiss951.com/listicle/this-north-carolina-city-is-the-no-1-place-for-glamping-in-america/