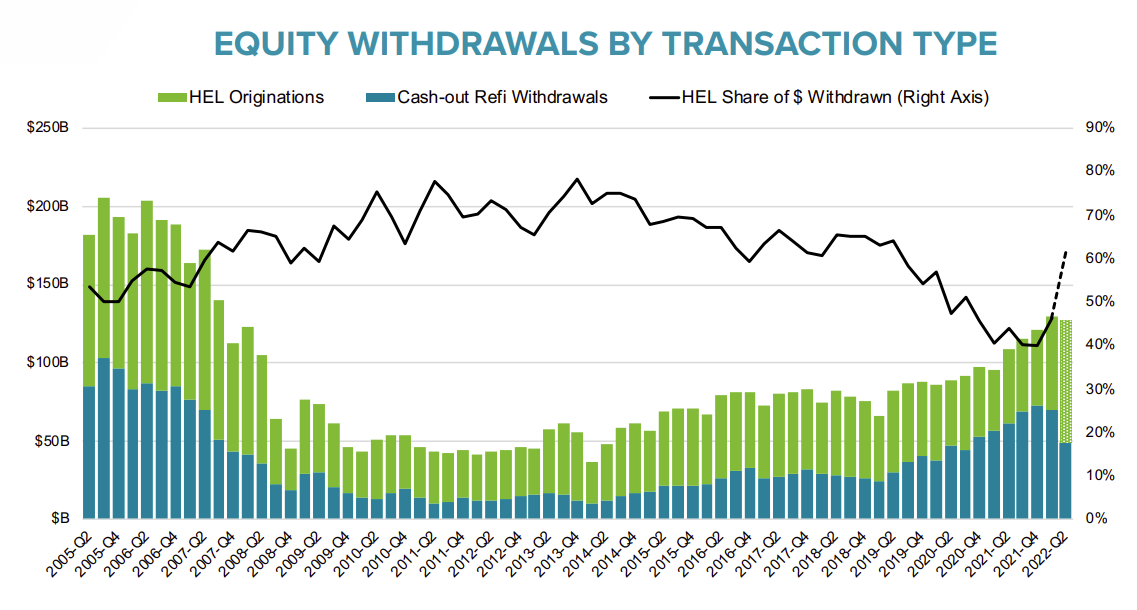
Refinance activity declined sharply this year as mortgage rates increased, and I was expecting MEW to also decline in Q2 as fewer homeowners used cash-out refinancing. However, homeowners have switched to using home equity loans (2nd loans) to extract equity from their homes. From Black Knight:
While withdrawals via cash-out refinances fell by 30% from Q1, preliminary data from the Black Knight home equity database suggests home equity lending was up nearly 30% quarter over quarter, the largest volume in nearly 12 years
Quarterly Increase in Mortgage Debt
Here is the quarterly increase in mortgage debt from the Federal Reserve’s Financial Accounts of the United States - Z.1 (sometimes called the Flow of Funds report) released on Friday. In the mid ‘00s, there was a large increase in mortgage debt associated with the housing bubble.
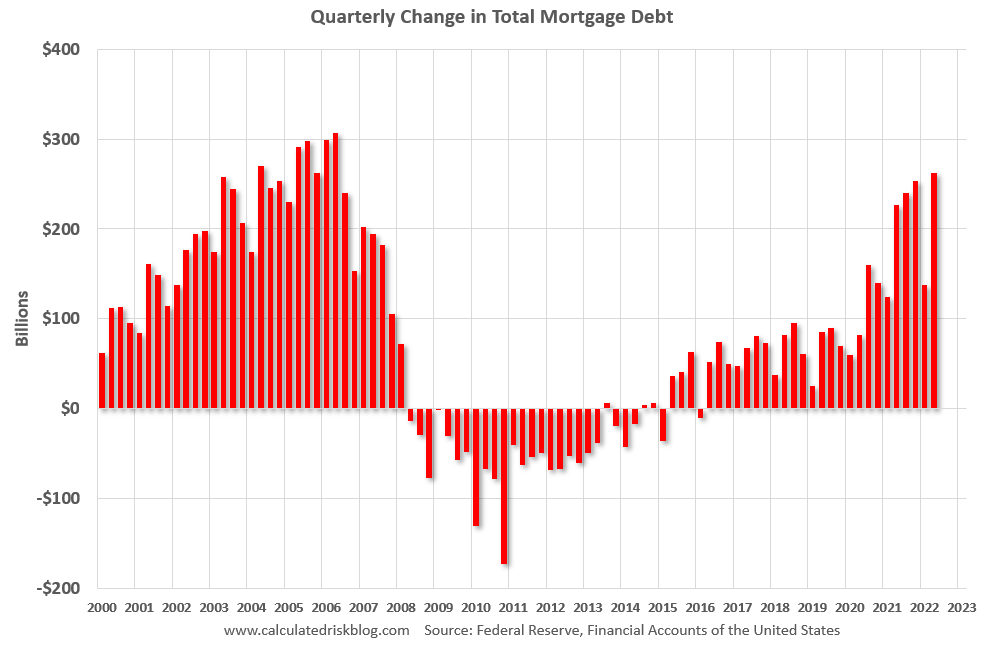
In Q2 2022, mortgage debt increased $263 billion, the most since 2006. Note the almost 7 years of declining mortgage debt as distressed sales (foreclosures and short sales) wiped out a significant amount of debt.
However, some of this debt is being used to increase the housing stock (purchase new homes), so this isn’t all Mortgage Equity Withdrawal (MEW).
Mortgage Debt as a Percent of GDP
The second graph shows household real estate assets and mortgage debt as a percent of GDP. Note this graph was impacted by the sharp decline in Q2 2020 GDP.
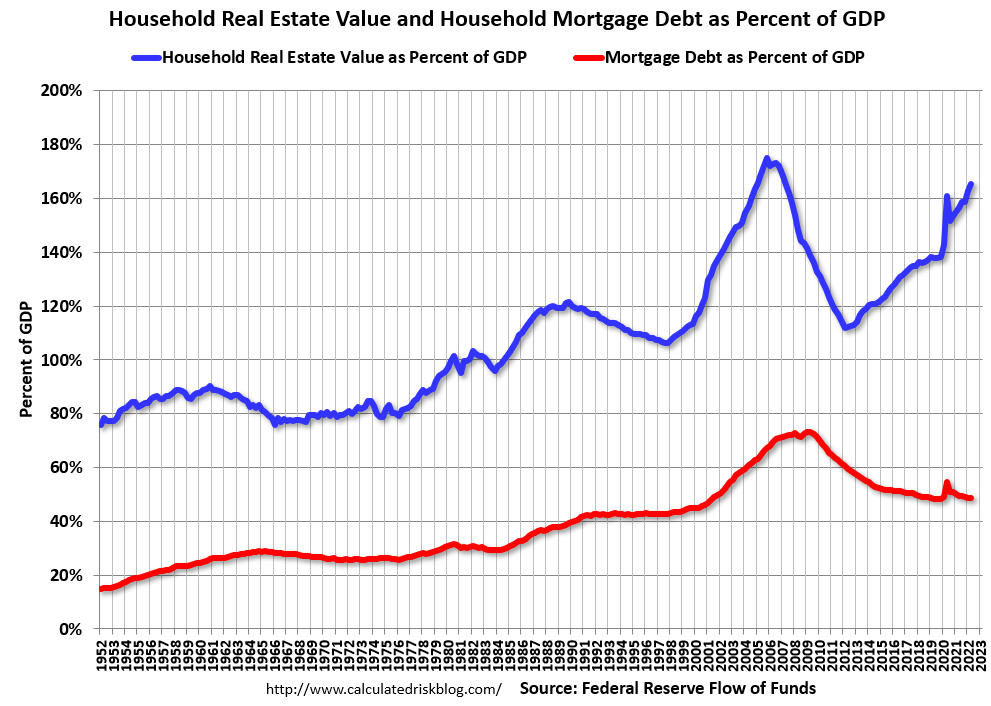
Mortgage debt is up $1.46 trillion from the peak during the housing bubble, but, as a percent of GDP is at 48.9% - up slightly from Q1 - and down from a peak of 73.3% of GDP during the housing bust. This means most homeowners have large equity cushions in their home, and some MEW is not a concern.
Calculated Risk Estimate of MEW
The following data is calculated from the Fed's Flow of Funds data and the BEA supplemental data on single family structure investment. This is an aggregate number and is a combination of homeowners extracting equity - hence the name "MEW" - and normal principal payments and debt cancellation (modifications, short sales, and foreclosures).
Note: This is not Mortgage Equity Withdrawal (MEW) data from the Fed. The last MEW data from Fed economist Dr. Kennedy was for Q4 2008.
For Q2 2022, the Net Equity Extraction was $169 billion, or 3.65% of Disposable Personal Income (DPI). The last year has shown a sharp increase in equity extraction compared to recent years, but the level is nothing like the amount of equity extraction during the housing bubble as a percent of DPI. During the housing bubble we saw several quarters with MEW above 8% of DPI.
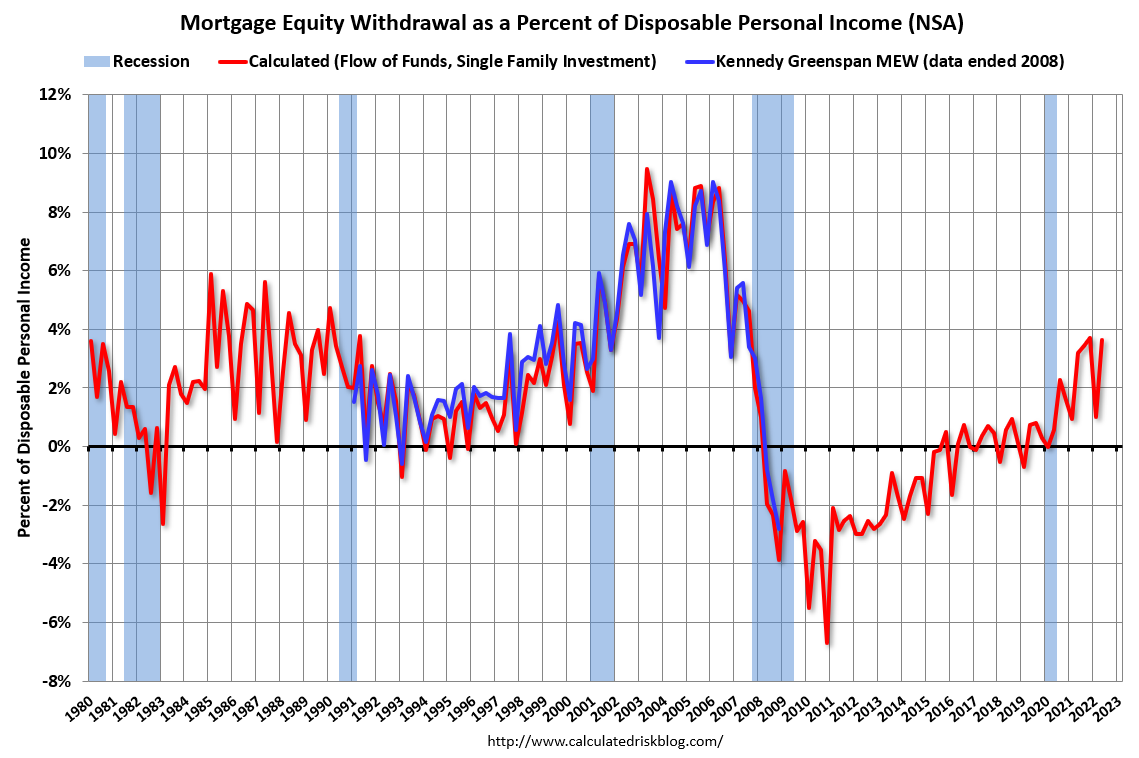
This graph shows the net equity extraction, or mortgage equity withdrawal (MEW), results, using the Flow of Funds (and BEA data) compared to the Kennedy-Greenspan method. MEW was negative for a number of years but has picked up again following the onset of the pandemic.
The bottom line is, despite the recent increase in MEW, it is far less as a percent of disposable personal income than during the bubble, and most homeowners have substantial equity. However, the “Home ATM” is still open with homeowners now relying on Home Equity lines to extract equity.
https://calculatedrisk.substack.com/p/mortgage-equity-withdrawal-still
No comments:
Post a Comment