During the housing bubble, many homeowners borrowed heavily against their perceived home equity - jokingly calling it the “Home ATM” - and this contributed to the subsequent housing bust, since so many homeowners had negative equity in their homes when house prices declined.
According to the Fed’s Financial Accounts of the United States - Z.1 (sometimes called the Flow of Funds report), mortgage debt increased about $250 billion per quarter for several years from 2003 through 2006. Some of this debt was being used to buy homes at ever higher prices, and some of the increase in debt was mortgage equity withdrawal (MEW) that was spent on home upgrades, new cars, boats and other “toys”.
The large amount of equity extraction raised concerns at the Federal Reserve, and former Fed Chair Alan Greenspan and Fed economist James Kennedy researched the Sources and Uses of Equity Extracted from Homes and released a quarterly estimate of MEW.
I had previously developed a simple model of MEW and it tracked the estimates from Kennedy and Greenspan very closely (more at bottom).
Quarterly Increase in Mortgage Debt
First, here is the quarterly increase in mortgage debt from the Federal Reserve’s report since 2000. In the mid ‘00s, there was a large increase in mortgage debt associated with the housing bubble.
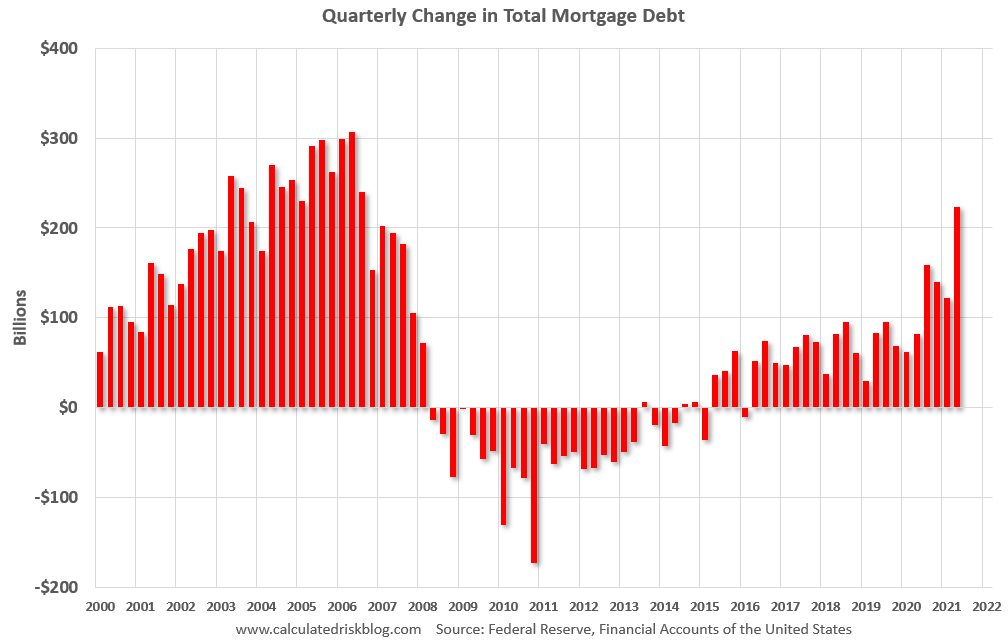
In Q2 2021, mortgage debt increased $223 billion, the largest quarterly increase since 2006. Note the almost 7 year of declining mortgage debt as distressed sales (foreclosures and short sales) wiped out a significant amount of debt.
However, some of this debt is being used to increase the housing stock (purchase new homes), so this isn’t all MEW.
Mortgage Debt as a Percent of GDP
Second, this graph shows household real estate assets and mortgage debt as a percent of GDP. Note this graph was impacted by the sharp decline in Q2 2020 GDP.
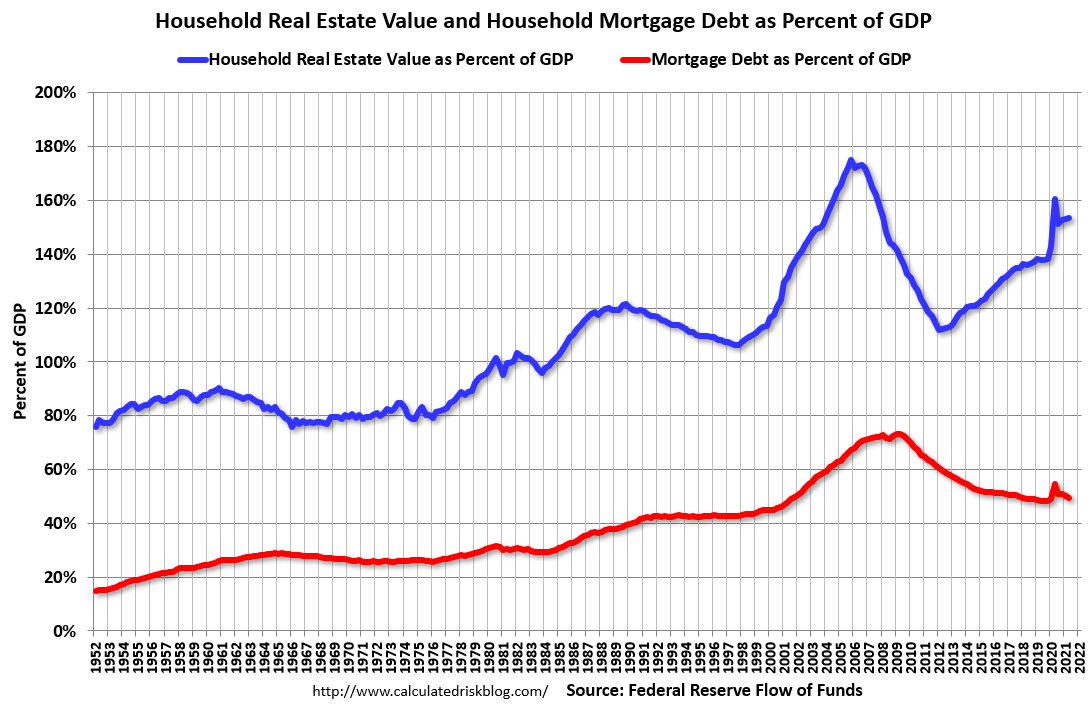
Mortgage debt is up $573 billion from the peak during the housing bubble, but, as a percent of GDP it is at 49.6%, down significantly from the peak of 73.3% of GDP during the housing bubble. This means most homeowners have large equity cushions in their home, and some MEW is not a concern.
Calculated Risk Estimate of MEW
The following data is calculated from the Fed's Flow of Funds data (released last Thursday) and the BEA supplemental data on single family structure investment. This is an aggregate number, and is a combination of homeowners extracting equity - hence the name "MEW" - and normal principal payments and debt cancellation (modifications, short sales, and foreclosures).
Note: This is not Mortgage Equity Withdrawal (MEW) data from the Fed. The last MEW data from Fed economist Dr. Kennedy was for Q4 2008.
For Q2 2021, the Net Equity Extraction was $142 billion, or 3.15% of Disposable Personal Income (DPI) . This is a sharp increase compared to recent years, but is nothing like the amount of equity extraction during the housing bubble as a percent of DPI. During the housing bubble we saw several quarters with MEW above 8% of DPI.
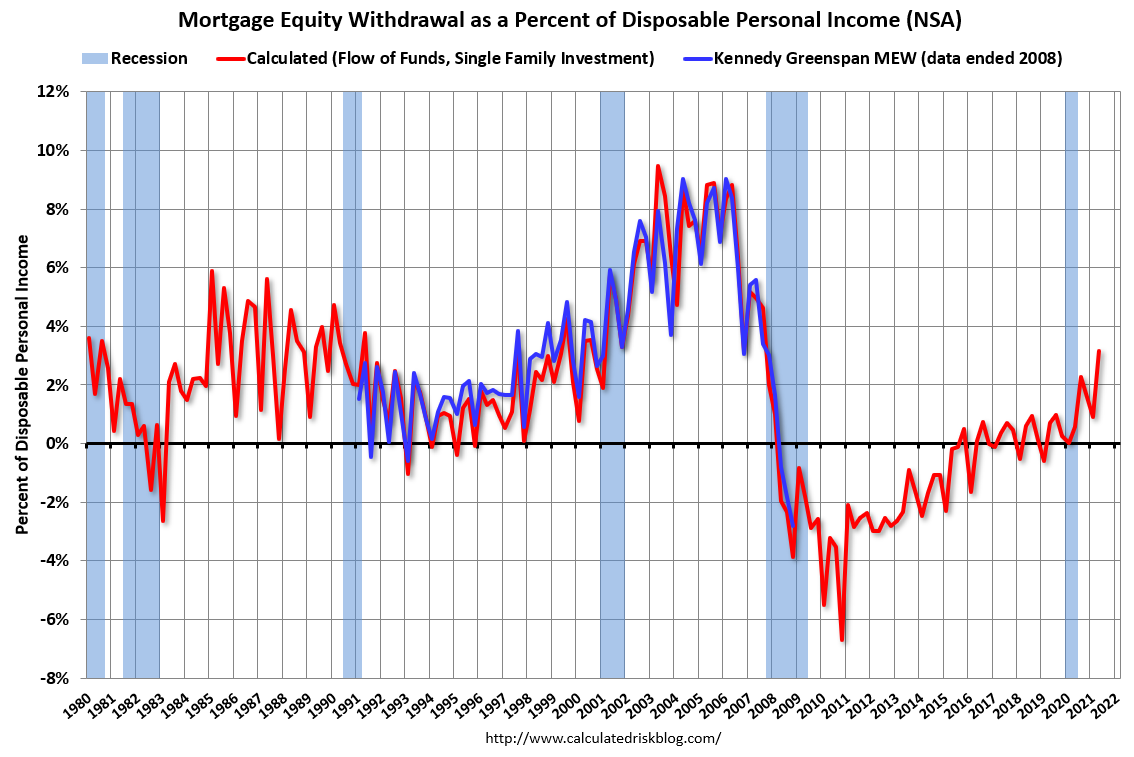
This graph shows the net equity extraction, or mortgage equity withdrawal (MEW), results, using the Flow of Funds (and BEA data) compared to the Kennedy-Greenspan method.
MEW was negative for a number of years, but has picked up again following the onset of the pandemic.
The bottom line is the recent increase in MEW is not concerning - it is far less as a percent of disposable personal income than during the bubble, and most homeowners have substantial equity.
No comments:
Post a Comment