by Dana Anderson via Redfin News,
There’s a total of $698 billion worth of homes for sale in the U.S., up 20.3% from a year ago and the highest dollar amount ever.
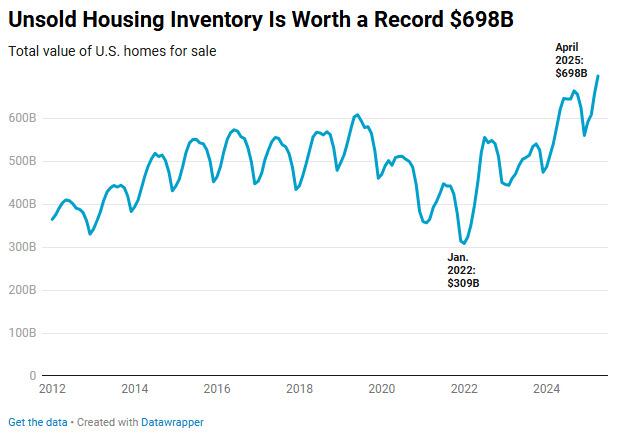
This is based on an analysis of listings on Redfin.com going back through 2012. For the total dollar value of all inventory on the market, we sum up the list price of all active U.S. listings as of the last day of each month; April 2025 is the most recent month for which data is available. For the purposes of this report, the term “value” is interchangeable with “list price”; i.e., when we refer to “total home value,” we mean the sum of all list prices. We define “stale inventory” as home listings that spend at least 60 days on the market and are actively listed for sale on the final day of the relevant month. Please see the end of this report for more on methodology.
The total value of U.S. home listings is at an all-time high because of the combination of growing inventory, slowing demand, and increasing home-sale prices:
- Housing supply is at a 5-year high. There are many more sellers than buyers in the market. The total number of homes on the market nationwide rose 16.7% year over year in April to its highest level in 5 years, with the mortgage-rate lock-in effect easing and homeowners trying to cash out due to economic uncertainty. New listings increased 8.6% to a 3-year high.
- Homes are sitting on the market longer. The typical home that sold in April took 40 days to go under contract, 5 days longer than a year earlier. There’s also a growing share of inventory that has been sitting on the market for longer than two months; see the next section of this report for more details.
- Homebuying demand is falling. Home sales are declining, and Redfin agents in much of the country report that would-be buyers are backing off due to record-high monthly housing costs and widespread economic instability.
- Home prices are rising. The median U.S. home-sale price rose 1.4% year over year in April. Note that the total value of inventory is up by much more, 20.3% year over year, which signals that in recent years, the rising number of listings is a bigger factor in the total value of inventory than rising prices.
Another Redfin analysis found that there are nearly 500,000 more home sellers than buyers in today’s housing market. The fact that so many homes are being listed without buyers out there to purchase them, along with continually rising prices, explains why there are 12 figures worth of unsold inventory sitting on the market.
“A huge pop of listings hit the market at the start of spring, and there weren’t enough buyers to go around,” said Matt Purdy, a Redfin Premier agent in Denver. “House hunters are only buying if they absolutely have to, and even serious buyers are backing out of contracts more than they used to. Buyers have a window to get a deal; there’s still a surplus of inventory on the market, with sellers facing reality and willing to negotiate prices down.”
Contrast today’s total value of inventory with the red-hot pandemic-era housing market, defined by tight supply. The total value of listings dropped to $309 billion in January 2022, the lowest dollar value in our records, which date back to 2012. At the start of 2022, mortgage rates were sitting at a near-record-low of 3.1%, homebuyers were hungry, and home supply was at its lowest level on record. Homes were flying off the market in 24 days, compared to today’s pace of 40 days.
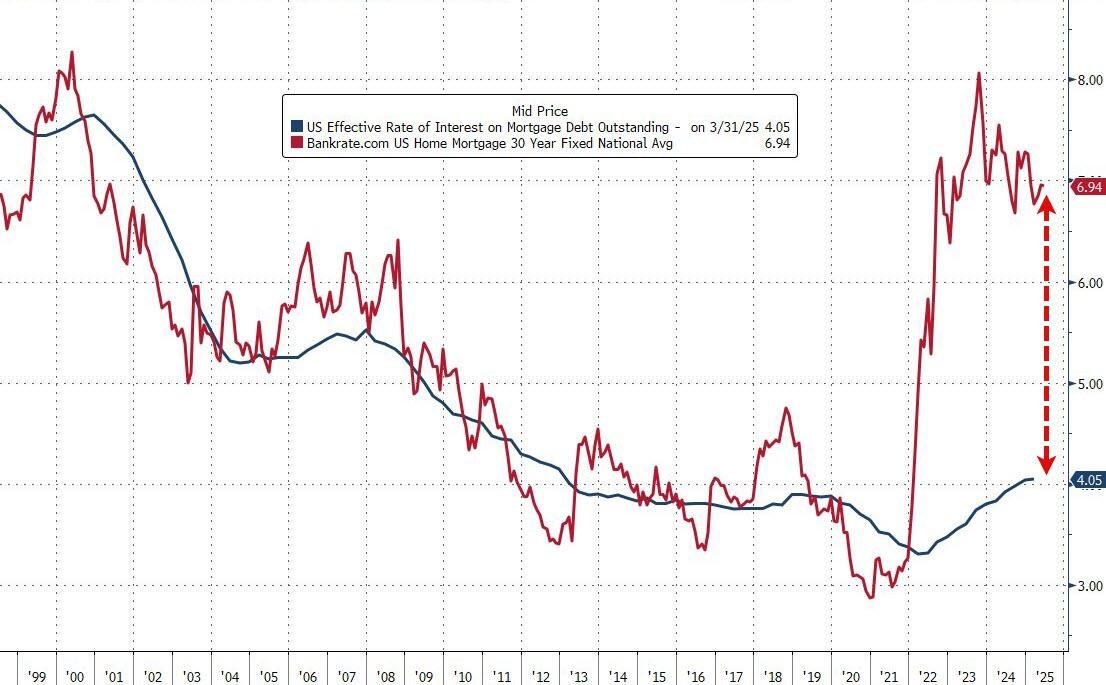
Meanwhile, look at the spread between current mortgage rates and the average effective rate for all homeowners...
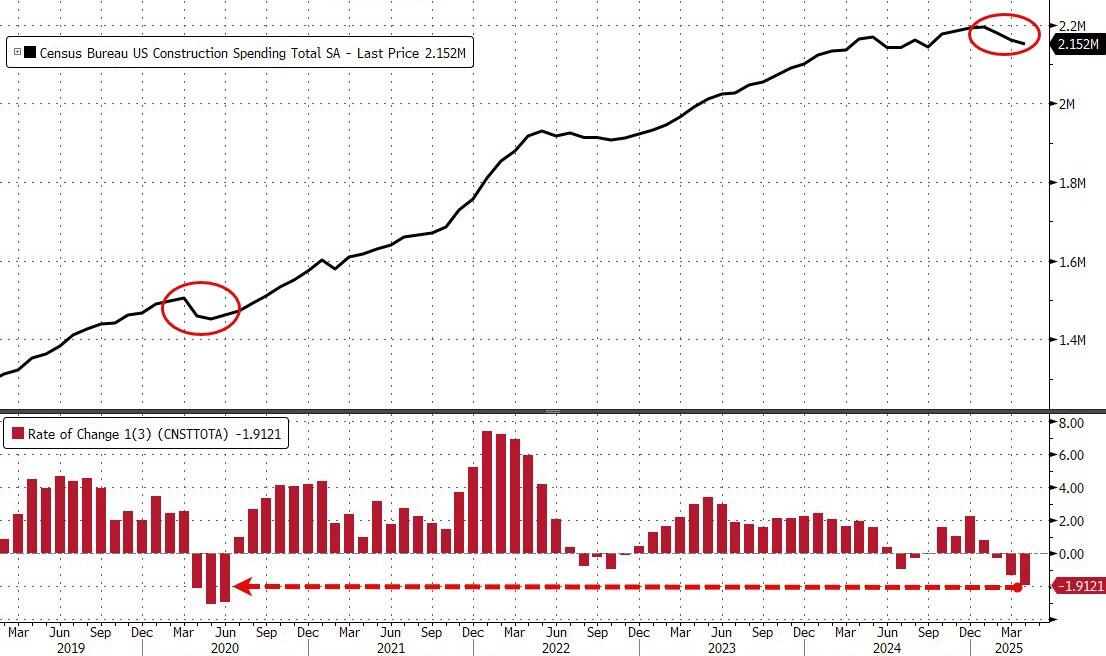
And then we have construction spending, which has fallen the most since COVID:
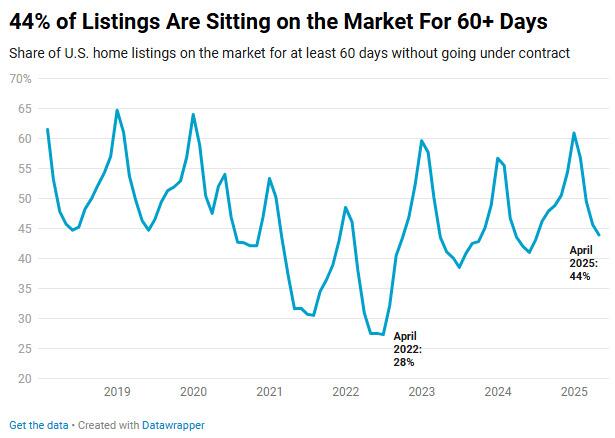
44% of Listings Have Been Lingering on the Market For 60+ Days
More than two in five (44%) listings in April had been on the market for at least 60 days without going under contract, which we refer to in this report as “stale inventory.” That’s up from 42.1% a year earlier, and the highest April share since 2020, when the start of the pandemic ground the housing market to a halt.
There’s $331 Billion Worth of Stale Inventory on the Market
The total value of that stale inventory is $331 billion, which accounts for nearly half of the dollar value of all inventory. That’s up 20.5% year over year.
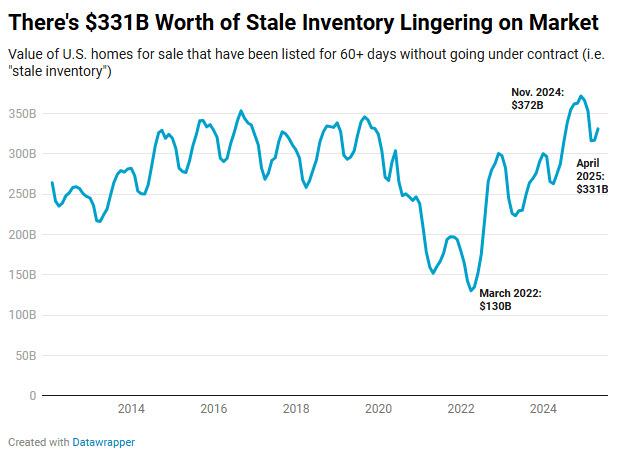
“The record-high dollar value of all homes listed for sale is one way to quantify this buyer’s market,” said Chen Zhao, Redfin’s head of economics research. “Not only are there more homes for sale than there have been in five years, but the value of those homes is higher than it has ever been. We expect rising inventory, weakened demand, and the prevalence of stale supply to push home prices down 1% by the end of this year, which should improve affordability for buyers because incomes are still going up.”
500,000 More Sellers than Buyers?!
As Redfin reported late last week, there are 34% more sellers in the market than buyers.
There are an estimated 1.9 million home sellers in the U.S. housing market and an estimated 1.5 million homebuyers. In other words, there are 33.7% more sellers than buyers (or 490,041 more, to be exact). At no other point in records dating back to 2013 have sellers outnumbered buyers by this large of a number or percentage. A year ago, sellers outnumbered buyers by just 6.5%, and two years ago, buyers outnumbered sellers.
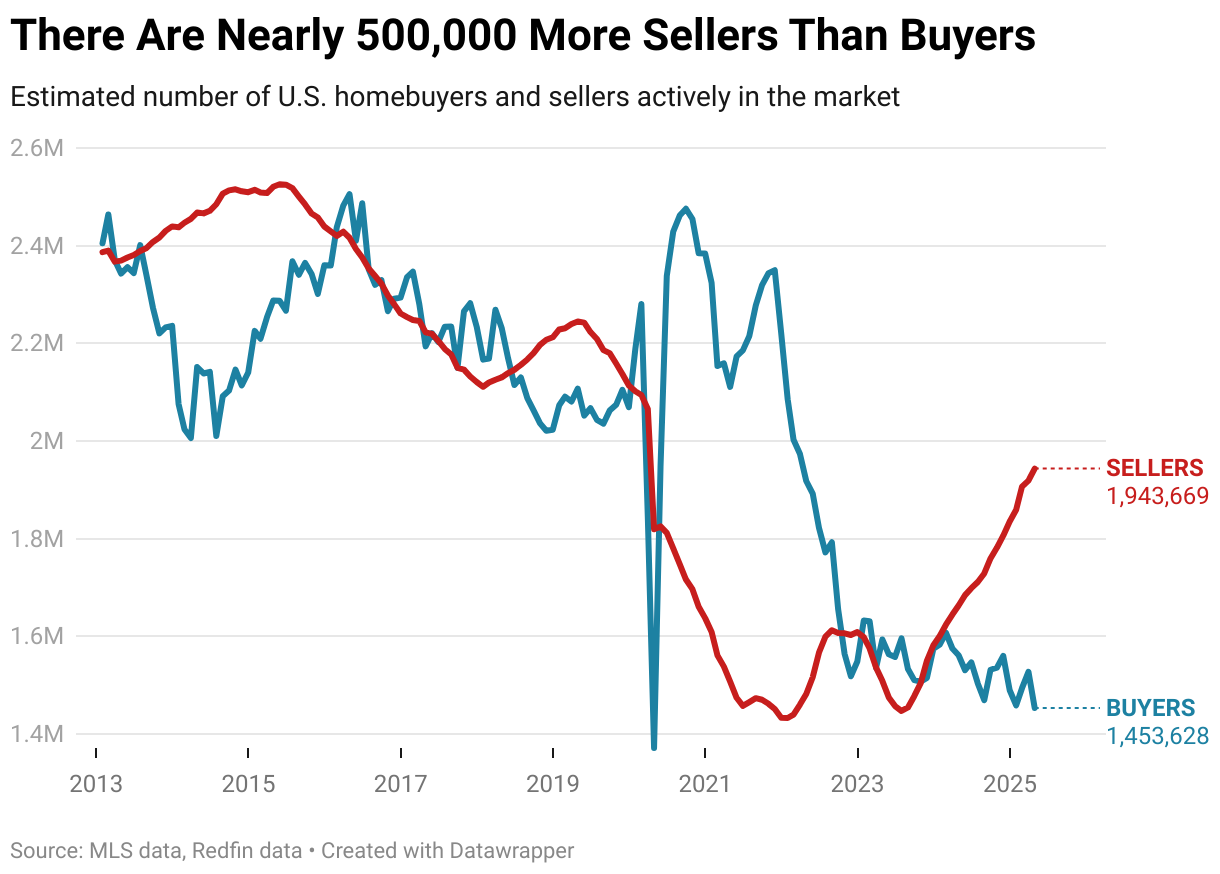
There haven’t been this many home sellers since March 2020. There haven’t been this few buyers at any point in records dating back to 2013 aside from April 2020, when the onset of the coronavirus pandemic brought the housing market to a halt.
The most recent data point in this analysis is April 2025. The estimated number of sellers in the market is simply the number of active listings in the MLS. To estimate the number of buyers, we created a model that uses data on pending sales and the typical time from a buyer’s first tour to their purchase. Scroll down for a full methodology and data on the 50 most populous U.S. metropolitan areas.
Redfin earlier this month predicted that home prices will drop 1% year over year by the end of 2025, and the growing imbalance between buyers and sellers is the basis for that prediction. When sellers are competing for a small pool of buyers, that indicates a buyer’s market. And when it’s a buyer’s market, home prices can fall because buyers have negotiating power.
Sellers outnumber buyers for several reasons:
- It’s expensive to buy a home: High home prices and mortgage rates are scaring buyers off. The median home sale price rose 1.6% year over year to $431,931 in April. That’s the slowest growth in nearly two years, but monthly housing payments still hit a record high last month because mortgage rates and prices remain elevated. The average 30-year-fixed mortgage rate was 6.73% in April—more than double the record low hit during the pandemic.
- Economic uncertainty: Tariff talks, layoffs, and federal policy changes are among the other factors dampening homebuyer demand. A recent Redfin survey found that nearly 1 in 4 Americans is scrapping plans to make a major purchase due to tariffs.
- The mortgage rate lock-in effect is easing: Homeowners who have been sitting on ultra-low mortgage rates they scored during the pandemic are now giving up those low rates and selling their homes. That’s because for most people, it’s not realistic to stay put forever; job changes, return to office mandates and divorce force people to move. The idea of taking on a higher mortgage rate also isn’t as shocking as it was when rates first skyrocketed in 2022.
“The balance of power in the U.S. housing market has shifted toward buyers, but a lot of sellers have yet to see or accept the writing on the wall. Many are still holding out hope that their home is the exception and will fetch top dollar,” said Redfin Senior Economist Asad Khan. “But as sellers see their homes sit longer on the market and notice fewer buyers coming through on tour, more of them will realize that the market has adjusted and reset their expectations accordingly.”
Sellers are already gaining more data points on this front, and will likely face another reality check in the summer, when demand typically starts to slow. More than two of every five (44%) home listings in April had been on the market for 60 days or longer—the highest April share since 2020. Stale inventory is piling up in part because many sellers are overpricing their homes, using sky-high comps from the recent seller’s market that aren’t realistic today. In some cases, sellers are pricing high because they bought at the peak of the market and are trying to recoup their investment.
The takeaway for sellers: Time is not on your side. If you are considering selling, do it sooner rather than later because home prices in your area may fall. If your home is already on the market and has been sitting for over a month, you may want to consider an improvement to your property or a reduction in price.
The takeaway for buyers: Many Americans have already been and will remain priced out of the housing market, even if prices decline. But for those who are still in the game, don’t get discouraged. Your purchasing power will increase if home prices fall, wages rise and mortgage rates remain steady as expected. Homes that would have been out of reach six months ago may come into reach as sellers entertain lower offers and concessions.
History Shows That Home Prices Cool When Sellers Outnumber Buyers
A change in the balance of buyers and sellers is a signal of what’s to come with home prices. Aside from the onset of the pandemic, the last time sellers significantly outnumbered buyers was around the time mortgage rates jumped in 2018.
In November 2018, the average 30-year-fixed mortgage rate peaked at 4.87%, which was the highest level in nearly eight years and almost a full percentage point higher than a year earlier. One month later, sellers outnumbered buyers by 9.4%—the largest percentage since 2015 and a reversal from the prior year, when buyers outnumbered sellers. Three months later, home-price growth shrunk to the lowest level in at least six years, with prices rising 2% from a year earlier to $283,912.
We saw a similar dynamic take hold in 2013-2014. As shown in the chart below, swings in the ratio of buyers to sellers are typically followed by similar swings in home-price growth.
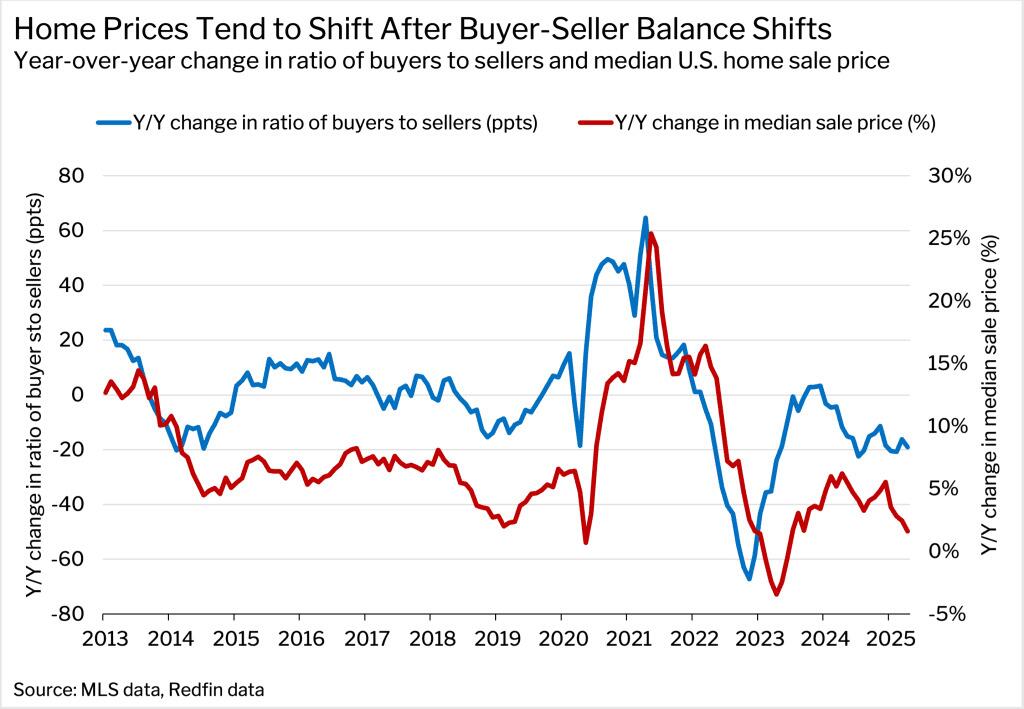
oday, the imbalance between buyers and sellers is even greater, meaning there’s more pressure on prices. Annual price growth has already slowed to 1.6% from 6.2% last spring, and we expect this trajectory to continue, ultimately causing prices to fall. The last time home prices posted a year-over-year decline was 2023.
Even as mortgage rates surged in 2022, buyers outnumbered sellers. Sellers most recently started outnumbering buyers in November 2023—the month after mortgage rates hit the highest level in over two decades, peaking at almost 8%. Homebuyer demand has been sluggish ever since, and is likely to remain so given widespread economic uncertainty and recession fears. What has changed recently is more sellers have started entering the market.
https://www.zerohedge.com/markets/nearly-half-700b-homes-sale-have-gone-stale-sellers-outnumber-buyers-500k


