Search This Blog

Tuesday, December 19, 2023

How The Fed Wrecked The Dream Of Homeownership

 by David Stockman via InternationalMan.com,

Recently, the Wall Street Journal pulled no punches with respect to the soaring cost of homeownership:

Homeownership has become a pipe dream for more Americans, even those who could afford to buy just a few years ago...

...it is now less affordable than any time in recent history to buy a home, and the math isn’t changing any time soon...

That means buyers get a lot less home for their dollar.

Before the Fed started raising rates, a person with a monthly housing budget of $2,000 could have bought a home valued at more than $400,000.

Today, that same buyer would need to find a home valued at $295,000 or less.

And, yes, you can blame the Fed for this baleful state of affairs, but not owing to the normal complaint that mortgage rates are too high.  Nor could the problem be remedied by government-imposed mortgage interest rate caps.

Actually, true mortgage rates are still sub-normal. What is way too high are home prices, and that condition is absolutely attributable to decades of interest rate repression, which is now taking a second bite of the apple owing to a severe, cheap-mortgage “lock-in” effect that is keeping millions of homes off the market.

With respect to super-cheap mortgage rates during the past decade and more, the home price inflation mechanism is simple: Homes are the quintessential leveraged asset—with current outstanding mortgage debt equal to nearly $13 trillion.  Accordingly, the marginal bid for properties is heavily debt financed, meaning that the lower real interest rates, the higher the market-clearing price of properties.

But now that home prices have been driven sky-high by cheap mortgage debt, prospective home buyers are being monkey-hammered by an economic double whammy. To wit, instead of going down as interest rates rise per the normal laws of economics, home prices are still going up owing to artificially scarce availability of units for sale. So when you multiply a higher mortgage rate times even higher home prices you get monthly mortgage payments that are way out of reach for an increasing share of US households.

What we are dealing with here, of course, are the purportedly “unintended” but predictable effects of the Fed’s heavy-handed attempts to set interest rates below—and usually deeply below—market-based levels. That is to say, the Eccles Building may not have intended to cause soaring home prices or to now cause owners to keep properties off the market in order to preserve low long-term mortgage rates, but that’s exactly what their foolish interest rate pegging policies have caused to happen.

So let’s unpack this Fed-caused mess one component at a time. At the current 7.5% nominal level, 30-year mortgage rates may seem high compared to the recent past, but viewed in the context of the last three decades they clearly are not.

That is to say, when a 7.5% mortgage rate becomes tantamount to a crisis, then something else is wrong. After all, between 1998 and 2007 the mortgage rate was well above current levels most of the time, but the housing market nonetheless boomed. Existing home sales averaged 6.0 million units per year (dotted line) and never fell below 5 million compared to the October 2023 level of just 3.79 million units.
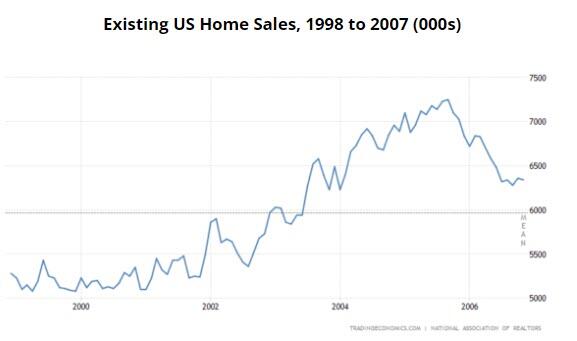
Existing US Home Sales, 1998 to 2007 (000s)

What is of greater salience, of course, is the inflation-adjusted mortgage rate since inflation tends to bloat both costs and income. Yet on this key metric, the current inflation-adjusted 30-year mortgage rate (purple line) of +2.52% is actually lower than at any time before Q3 2011. It appears elevated only by comparison to the aberration caused by the Fed’s frenzied money-pumping campaign during the pandemic when the real mortgage rate touched bottom at an absurd and utterly unsustainable -2.0% in Q1 2022.

In other words, save for a few months during the Washington-fostered financial insanity of 2020-2021, inflation adjusted mortgage rates today are at their lowest level in the last 25 years!

That surely can’t constitute a crisis.
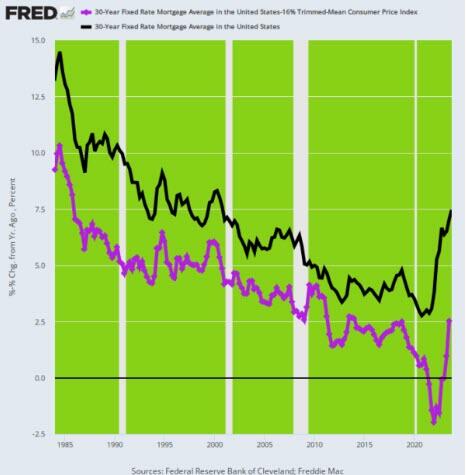
Nominal Versus Inflation-Adjusted 30-Year Mortgage Rate, 1998 to 2023

The actual crisis, of course, is on the home price side of the equation, where inflationary infirmities have been building for five decades. To wit, during the 50-years since Q1 1973 home prices (purple line) have risen by nearly 1,300% or by double the 610% gain in the CPI (red line).

Moreover, it is also evident from the chart that the thundering lesson of the 2007-2009 housing crash did not stick. After bottoming in Q1 2009, the median sales price of US homes rebounded by 130% by the peak of the pandemic stimulus in Q4 2022.
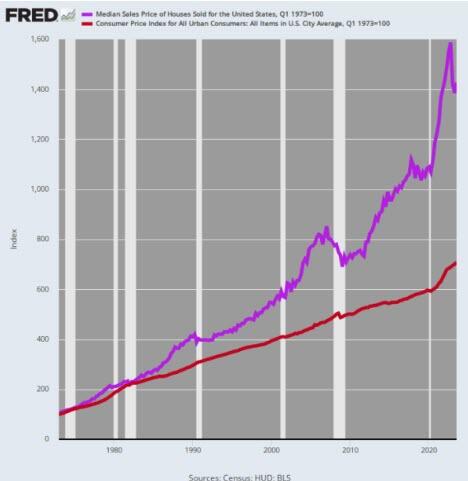
Change In Median US Home Sales Price Versus CPI, 1973 to 2023

Needless to say, if wages had stayed reasonably ahead of the general CPI inflation, the above relentless rise in median home prices would have been bad enough. But as it happened, average wages have gone nowhere in real terms for the past half-century.

Accordingly, this comparison of the inflation-adjusted hourly wage rate with the inflation-adjusted median home price is surely one for the book of freaky records. That is, during the last five decades the inflation-adjusted average wage (black line) has risen by just 1%. And to be clear, we are referring to the entire 50-year period, not a 1% annual increase.

By contrast, the inflation-adjusted median home price (purple line) has gained 100%. That’s right. Real home price gains have outpaced real wage gains by 100X.  Is it any wonder, therefore, that even the economically normalized real interest rates of the past few months have precipitated a housing affordability crisis?

The fact is, there is too much “price” in the monthly mortgage payment equation, not too much “rate”.
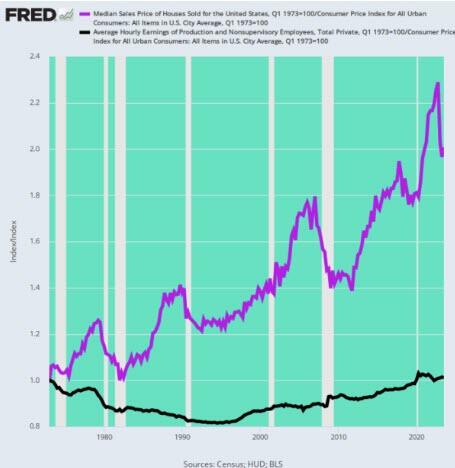
Real Average Wage Versus Real Median Home Price, 1973 to 2023

Stated differently, in Q1 1973 it took 3.9 years of work at the average hourly wage ($4.14 per hour) to equal the median home sales price ($32,600). That figure stood at 8.3 years in 2022.

Not surprisingly, therefore, the Home Affordability Index of the National Association Of Realtors is currently at a 37-year low.
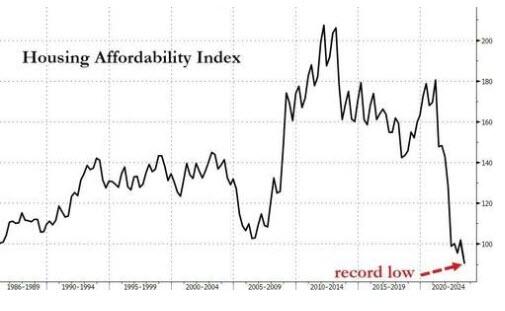
US Fixed Housing Affordability Index data by ZeroHedge

Needless to say, the Fed’s post-2000 money-printing spree has delivered the coup d’ grace for housing affordability. The last time 30-year mortgage rates (black line) were above 7% was Q1 2001, when the median home price (purple line) stood at just $179,000.

Currently, the median home price stands 140% higher at $431,000. Accordingly, the additional interest on the added price, assuming 80% loan-to-value, is more than $15,000 per year.

30-Year Mortgage Rate Versus Median Home Price, 2001 to 2023   

Needless to say, the concept of “mortgage rate prisoner” is not simply a catchy metaphor. Current data on interest rate levels on outstanding home mortgages leaves little to the imagination. As of the first quarter of 2023, a striking 95.2% of outstanding mortgages were fixed-rate loans. On a dollar volume basis, a staggering 70% of these loans are locked in at interest rates of 4% or lower, while nearly 30% are at less than 3.0%.

In dollars and cents terms we are not talking about small economic potatoes here. There are nearly $13 trillion of home mortgages outstanding, meaning that upwards of $9.0 trillion carry interest rates below 4%. Based on the data, the average rate on these low-rate mortgages wouldn’t be much above 3.3%, meaning that the interest carry-cost difference compared to the current market rate of 7.5% is upwards of $400 billion per annum.

Moreover, the average interest rate across all mortgages currently stands at just 3.7%. That means the average current mortgage holder is paying a rate only 49% of today’s market rate for new mortgages. So when it comes to market distortion and lock-in effects, this is one for the history books, too.

Of course, the question recurs as to whether all this distortion—-windfalls earlier and lock-in effects now—was worth the bother. We’d suggest the data below implies a resounding, no!

After all, the purpose of artificially suppressing mortgage rates over the past several decades was to goose the rate of new housing investment and construction. But in no way, shape or form did that happen. On a housing completions per capita basis, the level today is 55% lower than it was in 1971, when Tricky Dick Nixon put the FOMC in charge of the value of our money.
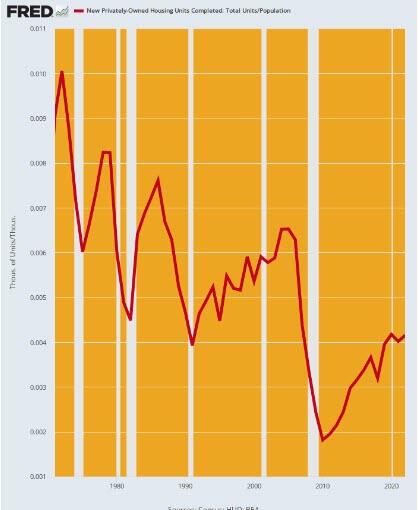
Per Capita New Housing Unit Completions, 1971 to 2023

So to repeat, the Fed’s relentless money-pumping and interest rate falsification did have one clear effect on housing, albeit not the Keynesian claim that it produced more housing units for the people. What it actually did was inflate housing prices to a fare-the-well. That is, it drove-up the price of existing assets, not the level of investment in new assets.

And now that the Fed is finally being forced to lean hard into the wind of inflation, the traditional dream of home ownership is truly out of reach for a growing majority of US households: Rates are high, supply is low, prices are still rising, and affordability has become prohibitive.

That’s still another reason to take the keys to the open market desk away from the monetary central planners at the Eccles Building.  Attempting to peg and micromanage interest rates generates for more harm than good.

Besides, as we have shown elsewhere, a discount window providing Fed credit at market rates plus a penalty spread to member banks would provide more than enough liquidity backstop for today’s financial system. And it would operate passively, driven by market forces and the generation of new economic production and commercial collateral.

Most importantly, asset bubbles, main street inflation and systematic malinvestment wouldn’t happen - even as the opportunity for homeownership would once again come into reach of middle-class households.

https://www.zerohedge.com/personal-finance/stockmanhow-fed-wrecked-dream-homeownership

Saturday, December 16, 2023

US homelessness hits highest level as rents have soared

 As housing in the US has become increasingly unaffordable over the past few years, the number of people experiencing homelessness surged to its highest level on record this year, according to an annual survey taken in January.

The number of unhoused people in the United States jumped by 12% early this year from the year before, an increase of about 70,650 people, according to an annual report from the Department of Housing and Urban Development released on Friday.

Known as a “point-in-time” estimate, the annual snapshot looks at the number of individuals nationwide who are living in shelters, temporary housing and unsheltered settings on one night last January. The report found that more than 650,000 people were experiencing homelessness that night, the most since reporting began in 2007.

“Homelessness is solvable and should not exist in the United States,” said HUD Secretary Marcia Fudge in a statement. “We’ve made positive strides, but there is still more work to be done. This data underscores the urgent need for support for proven solutions and strategies that help people quickly exit homelessness and that prevent homelessness in the first place.”

Homelessness increased nationwide across all household types, the report found, but had an outsized impact on communities of color. While Black people make up about 13% of the US population, they comprise 37% of people experiencing homelessness and 50% of the people who are experiencing homelessness as a member of a family with children.

The Asian or Asian American population saw the biggest increase in the rate of homelessness between 2022 and 2023, with a 40% increase. About 3,313 more Asian and Asian American people were unhoused.

The biggest numerical growth in people experiencing homelessness was among Latinos. There were 28% more Latinos who were unhoused in 2023 than the year prior. This population made up 55% of the total increase in US homelessness, with 39,106 additional Latinos without housing this year.

The survey also found a sharp jump in the number of people who became homeless for the first time.

Between federal fiscal year 2021 and 2022, the number of people who became newly homeless increased by 25%, even as the number of people who exited homelessness to permanent housing increased by 8%, according to the HUD report.

This rise is the result of a combination of factors, according to HUD.

Rent has climbed significantly over the past few years. By November of this year, the national median asking rent in the US was beginning to come down some, but it is still 22% higher than it was in November 2019 before the pandemic housing boom, according to Redfin. And the median asking rent for all apartments was just 4% below the $2,054 record high hit in August 2022.

In addition, the HUD report found, in 2022 the winding down of pandemic protections and programs focused on preventing evictions may also have contributed to more people finding themselves homeless in the first month of 2023.

“We must address the main driver of homelessness and housing instability — the gap between low incomes and rent costs,” said Peggy Bailey, vice president for Housing and Income Security at the Center on Budget and Policy Priorities in a statement.

“We have learned a lot from approaches that have targeted specific populations and helped them exit homelessness,” she said. “Now we need to take those lessons and broaden them to ensure that anyone who needs help, gets it, period.”

In the nearly one year since the HUD count was conducted, the administration has taken several steps aimed at preventing homelessness and supporting the unhoused.

Through implementation of the Housing Supply Action Plan, more apartments are on track to be built this year than any year on record. This week, HUD announced that it has helped more than 424,000 households connect to homeless support services, exit homelessness, or avoid homelessness altogether in 2023. Earlier this month, the Veterans Administration announced that it has housed more than 38,000 homeless veterans.

https://www.cnn.com/2023/12/15/business/homelessness-highest-reported-level-rents-up/index.html

Redfin: Falling Mortgage Rates Breathe New Life Into Housing Market


Listings, Pending Sales and Price Growth Hit Highest Level in Roughly a Year

Redfin reports more homes are changing hands as mortgage rates drop and buyers and sellers see more eye to eye on price. Still, deals are falling through at the highest rate on record due to lingering economic uncertainty, and some metros continue to see price declines.

https://www.businesswire.com/news/home/20231215449287/en/

Thursday, December 14, 2023

Coming Fed Rate Cuts and the Impact on Mortgage Rates

 Following the FOMC meeting, Goldman Sachs economists wrote:

The soft PPI report on Tuesday morning combined with downward revisions to prior months implies that core PCE inflation was only 0.07% month-on-month and—as Chair Powell noted in the press conference—only 3.1% year-on-year in November. By some measures, the trend is already at or near 2%.

In light of the faster return to target, we now expect the FOMC to cut earlier and faster. We now forecast three consecutive 25bp cuts in March, May, and June to reset the policy rate from a level that the FOMC will likely soon come to see as far offside, followed by quarterly cuts to a terminal rate of 3.25-3.5% …
emphasis added
Market participants are also pricing in one 25 bp cut in March, and 2nd in May, and a 3rd in June, bringing the Fed Funds target range down to 4.50% to 4.75% by June 12, 2024. With the Ten-Year yield currently at 3.93%, the yield curve would still be inverted in June.

Tuesday, December 12, 2023

Another housing crash? These are the markets most at risk of a downturn

 Those who remember the housing bust in the 2000s, and the glut of foreclosed and abandoned homes that followed, might wonder if another one is just around the corner.

While most real estate experts don’t believe another housing crash will materialize anytime soon, there are housing markets that are more prone to another downturn than others. The most vulnerable states are California, New Jersey and Illinois, according to a special housing risk report from real estate data firm ATTOM. New York City had the most neighborhoods that could be at risk.

These three states had 33 of the 50 counties that were the most vulnerable to experiencing large price drops.

The report looked at home affordabilityforeclosures, underwater mortgages, and unemployment in 578 counties with enough data to analyze in the third quarter of 2023.

“Some parts of the country continue to pop up on the radar as places to watch for signs of housing-market drop-offs,” ATTOM CEO Rob Barber said in a statement.

The housing market and the general economy remain strong, despite the fast run-up in home prices over the past few years. Unlike during the Great Recession, there are now more buyers than there are homes available. And in the wake of the last housing bubble, changes were made to lending to ensure that only the most qualified buyers, who are unlikely to default, are given loans.

New York City had the most at-risk counties, such as Richmond County.Roman Babakin – stock.adobe.com
Also in the mix, Bergen County in New Jersey.Christopher Sadowski

In addition, most homeowners are sitting on some substantial home equity thanks to that strong home appreciation. Unemployment remains low. So if homeowners were to run into some financial trouble, many would be able to sell their homes and even pocket a profit in some cases rather than succumbing to a foreclosure.

“It is important to stress that getting onto the most-vulnerable list doesn’t signal an imminent crash for any local market,” Barber said. “It just means that they have greater potential tripwires that could lead to a decline.”

Which housing markets are the most vulnerable to a downturn?

The New York City housing market had the most at-risk counties. There were nine counties in and around the nation’s largest city, including Kings (aka Brooklyn), Richmond (aka Staten Island), and the Bronx. The other six counties were in the New Jersey suburbs: Bergen, Essex, Ocean, Passaic, Sussex, and Union.

New York City was closely followed by the Chicago metropolitan area, which had seven vulnerable counties. The most at-risk were Cook, DeKalb, Kane, Lake, McHenry, and Will in Illinois and Lake in Indiana.

New York was closely followed by Chicago.Creative Studio 79 – stock.adobe.com
Out west, Fresno County is also at risk.Los Angeles Times via Getty Images

There were five in Central California: Fresno, Madera (near Fresno), Merced (near Fresno), San Joaquin County (Stockton), and Stanislaus (Modesto.)

These counties are riskier because they have higher unemployment rates and higher percentages of homeowners who have received a foreclosure notice or owe more than their properties are worth.

“Those remain areas to watch, especially given the overall varied trends in the market,” Barber said.

Which housing markets are the least vulnerable to a downturn?

The housing markets that are the least at risk of another housing crash are predominantly in the South, followed by the Midwest, and then New England. These areas tended to have strong employment and fewer homeowners who were in danger of losing their homes to foreclosures.

Seven of the 50 least vulnerable counties were in Tennessee, with three in the Nashville area (Davidson, Rutherford, and Williamson) and two in the Knoxville area (Blount and Knox).

Four counties were in Wisconsin and another four were in Virginia, which included Alexandria and Fairfax in the Washington, DC, area. The Boston metropolitan area also had four very stable counties, with Middlesex and Sussex in Massachusetts and Rockingham and Strafford in New Hampshire.

https://nypost.com/2023/12/12/real-estate/another-housing-crash-these-are-the-markets-most-at-risk-of-a-downturn/

Monday, December 11, 2023

US flags early 2024 for new rule targeting real estate money laundering

 The U.S. Treasury Department on Monday said its Financial Crimes Enforcement Network (FinCEN) unit is planning to propose a long-awaited rule aimed at curbing money laundering in real estate in early 2024.

The regulator is also aiming to issue a notice of proposed rulemaking that would require investment advisers flag suspicious transactions to regulators.

THE TAKE

The proposal, which FinCEN was previously slated to unveil this year, is expected to require real estate professionals report the identities of the beneficial owners of companies buying real estate in cash to the regulator.

Anti-corruption advocates have been pushing for years for regulators to close a loophole they say allows criminals to hide money in U.S. real estate.

THE CONTEXT

While banks have long been required to understand the source of customer funds and report suspicious transactions, no such rules exist nationwide for the real estate industry. Criminals have for decades anonymously hidden ill-gotten gains in real estate, Treasury Secretary Janet Yellen said earlier this year.

The existing regulatory regime for real estate is easy to skirt, anti-corruption advocates have said.

KEY QUOTE

The proposal "will be will be an important step toward bringing greater transparency to this sector," the agency said in a statement.

"Treasury is also considering next steps with regard to addressing the illicit finance risks associated with the U.S. commercial real estate sector.

https://www.marketscreener.com/news/latest/US-flags-early-2024-for-new-rule-targeting-real-estate-money-laundering-45544043/